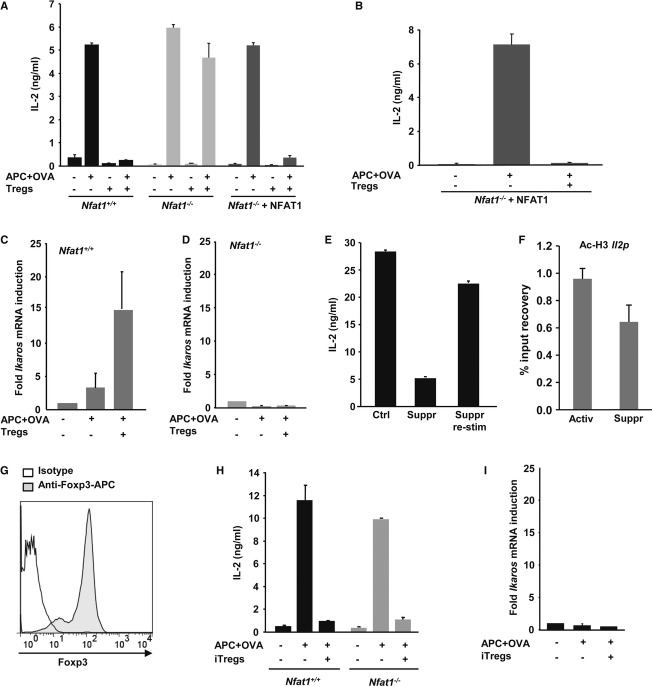
Figure 2. Suppressed CD4+ T cells upregulate the NFAT1-dependent expression of Ikaros.
A Th1 cells from WT or Nfat1−/− DO11.10 mice transfected with a control (WT and Nfat1−/− cells) or NFAT1-expressing (Nfat1−/− cells) retrovirus were stimulated with APC-OVA for 48 h with or without WT Tregs (1:1). IL-2 production determined by ELISA (mean + s.e.m. of three experiments).
B Nfat1−/− DO11.10 Th1 cells transfected with a plasmid expressing NFAT1 were activated as described in (A) (mean + s.e.m. of three experiments).
C, D WT (C) and Nfat1−/− (D) DO11.10 Th1 cells were stimulated with APC-OVA with or without Tregs (1:1) for 12 h. Th1 cells were reisolated and RNA obtained. Results (mean + s.e.m. of three experiments) show Ikaros mRNA fold induction relative to resting cells.
E IL-2 expression in DO11.10 Th1 cells activated as described in (A). Th1 cells were reisolated, rested for 4 h, and restimulated (mean + s.e.m. of three experiments).
F WT and Nfat1−/− Th1 cells were stimulated with APC-OVA in the presence or absence of Tregs (1:1) for 24 h. Th1 cells were reisolated and Histone H3 acetylation at the Il2 promoter measured by ChIP (mean + s.e.m. of three experiments).
G FACS analysis of Foxp3 expression in iTregs.
H WT and Nfat1−/− DO11.10 Th1 cells were stimulated with APC-OVA in the presence or absence of iTregs (1:1) for 48 h. IL-2 values are mean + s.e.m. from three experiments.
I Th1 cells were activated for 12 h as in (H). Th1 cells were reisolated and RNA obtained. Results (mean + s.e.m. of three experiments) show Ikaros mRNA fold induction relative to resting cells.
Source data are available online for this figure.

