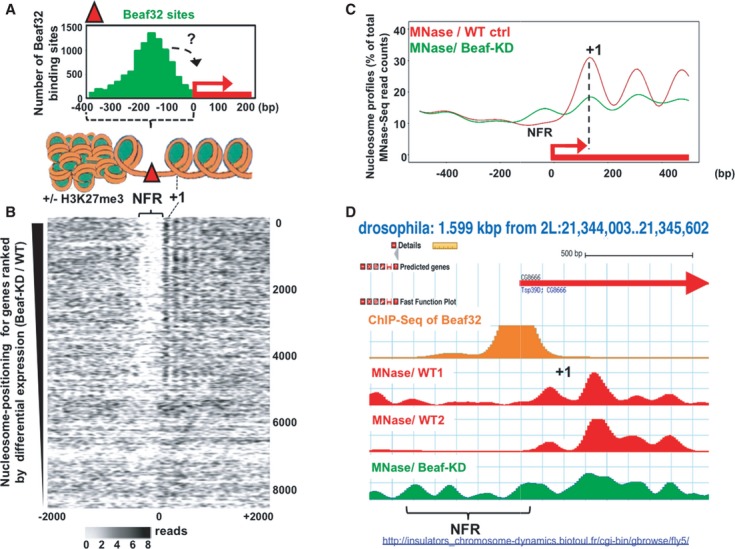
Figure 1. Beaf32-mediated regulation of gene expression correlates with high NFR and nucleosome positioning.

- Histogram representing the mapping of Beaf32 sites identified by ChIP-Seq using specific anti-Beaf32 antibodies (Supplementary Fig S1A) with respect to promoters (TSS = 0) and to chromatin structure (see scheme illustrating the results obtained by MNase-Seq in B). “+/− H3K27me3” indicates that Beaf32 sites are enriched but not necessarily flanking H3K27me3/heterochromatin domains as previously shown (Sexton et al, 2012).
- Heat map of nucleosome positioning as measured by MNase-Seq (see Materials and Methods) along the promoter regions of genes ranked according to their differential expression between wild-type control (“WT ctrl”) or Beaf32-depleted (“Beaf32KD”) cells (top: most differentially expressed; bottom: similarly expressed genes). Nucleosomes were aligned relative to TSS (x-axis; position 0) of genes. Nucleosome positions are indicated by a gradient proportional to the distribution of MNase-Seq reads (see Materials and Methods), as previously done (Schones et al, 2008). NFR, Nucleosome Free Regions; +1, positioning of the first nucleosome after the TSS of genes (see also Supplementary Fig S2A).
- Averaged nucleosome positioning as determined by MNase-Seq in Beaf32-KD (green curve) and control cells (red curve). Nucleosome positions (y-axis, number of MNase-Seq reads) were aligned along the TSS of genes (x-axis, TSS = position 0) where most significant changes in nucleosome positioning were scored (˜2,000 genes; see Materials and Methods). Note that genes harboring most significant changes in nucleosome positioning upon Beaf32-KD are highly enriched among Beaf32 bound genes (see Supplementary Fig S2B-C).
- Example illustrating the variations in nucleosome positioning from our MNase-Seq data accessible through http://insulators_chromosome-dynamics.biotoul.fr/IBPs as observed in Beaf32-KD compared to control cells from this study (“WT1”) or an independent study (“WT2”) (Gilchrist et al, 2010). NFR, Nucleosome Free Regions; +1, positioning of the first nucleosome after the TSS of genes.
