
Figure 3. dMes-4 depletion recapitulates the gene expression defects upon Beaf32-KD.
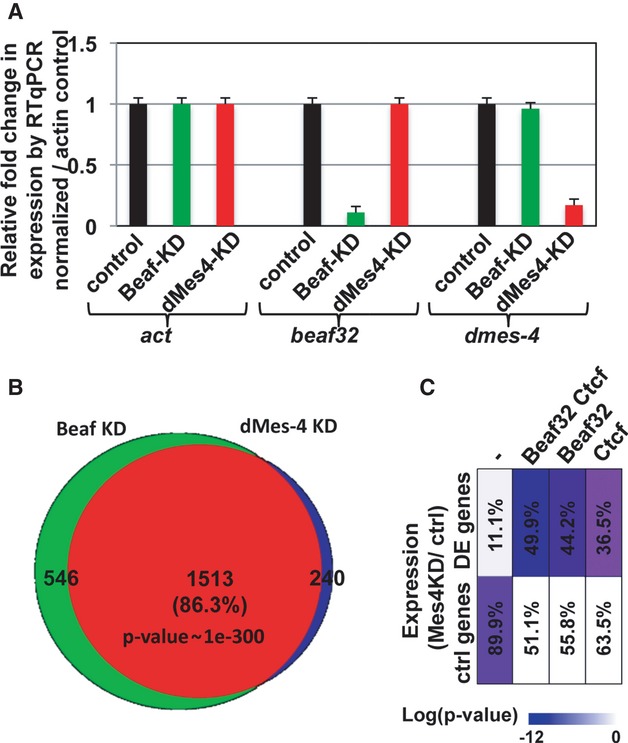
- Graph showing the expression levels of dmes-4 or beaf32 normalized to actin control as measured by three independent RT-qPCR analyses in dMes-4-KD, Beaf32-KD, or control cells (see also Supplementary Fig S3 for confirmation of dMes-4 depletion by Western blotting).
- Venn diagram showing the intersection between differentially expressed genes in Beaf32-KD or dMes-4-KD compared to control cells as obtained by genome-wide expression analyses (see Materials and Methods). Note that differentially expressed genes are enriched in specific gene ontologies (see Supplementary Fig S4; Supplementary Table S1).
- Graphical representation of the enrichment in differentially expressed genes upon dMes-4 depletion as a function of the presence of unique or multiple binding site(s) for the IBPs dCTCF and Beaf32 (see also Supplementary Fig S4E). Note that many gene promoters are flanked by both dCTCF and Beaf32 binding sites as shown (Bushey et al, 2009). The scale bar represents the enrichments as the log of the P-values. The percentages of differentially regulated genes (dMes-4KD/WT) are also indicated for each category of promoters.