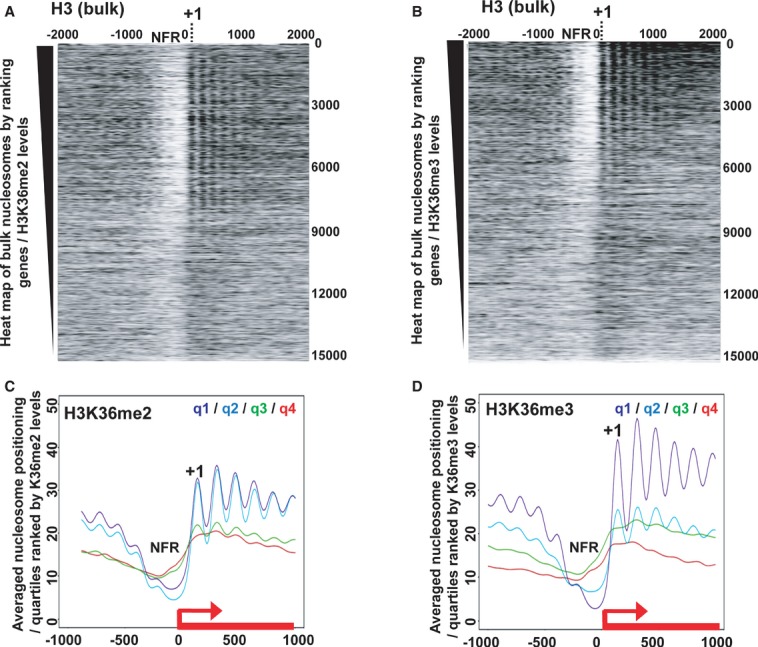
Figure 4. dMes-4 prone Set-2/Hypb H3K36me3-mediated nucleosome positioning.

- Heat map of nucleosome positioning as measured by MNase-Seq along all Drosophila genes ranked according to H3K36me2 levels. Top: highest H3K36me2 levels in wild-type cells. Nucleosomes were aligned relative to TSS (x-axis; position 0) of genes. NFR, Nucleosome Free Region; +1, positioning of the first nucleosome.
- Same as in (A) except that genes were ranked according to H3K36me3 levels.
- Averaged nucleosome positioning for genes ranked according to quartiles defined by the amount of ChIP-Seq reads of H3K36me2 (from q1/highest to q4/lowest levels; see Materials and Methods). y-axis, number of MNase-Seq reads; x-axis, alignment along the TSS of genes (TSS = position 0).
- Same as in (C) except that quartiles were defined according to H3K36me3 levels.
