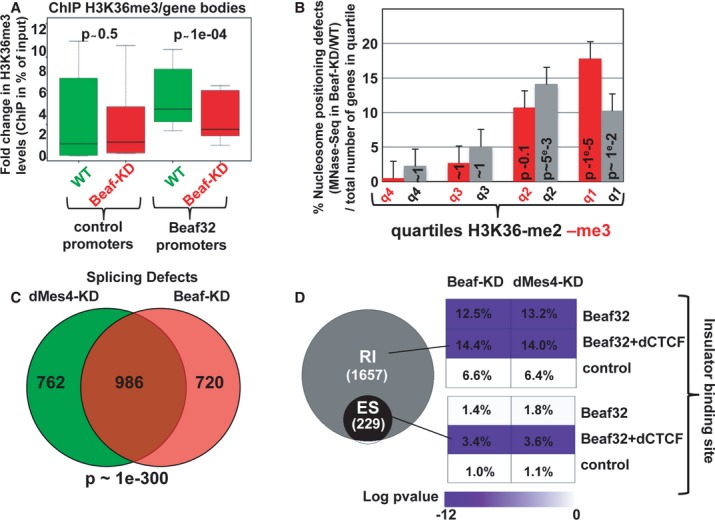
Box plot showing the results of ChIP experiments showing the H3K36me3 levels in Beaf32-KD (red boxes) compared to control cells (green boxes) in percent of input (y-axis) as obtained by performing ChIP with anti-H3K36me3 antibodies or IgG control and after normalization to three control loci (see Materials and Methods). Samples were analyzed by qPCR analyses in triplicates and for three independent measures for the bodies of genes whose promoters were bound by Beaf32 or not (see Materials and Methods for a list; see also Supplementary Fig S6).
Histogram showing the percentage of genes with nucleosome positioning defects as measured by MNaseSeq read counts in Beaf32-KD compared to WT cells as previously (see Supplementary Fig S2; Materials and Methods), as a function of the H3K36-me2 or -me3 quartiles. The error bars represent the variations found between two independent measures. The number of genes corresponding to four quartiles is 204/355, 281/213, 101/53, and 44/9 for H3K36-me2/-me3, respectively.
Venn diagram showing the intersection analysis of genes with splicing defects (see Materials and Methods) upon dMes4-KD (left) or Beaf32-KD (right) as compared to control cells.
Venn diagram showing the specific RNA splicing defects (expressed in log P-value) measured upon Beaf32-KD compared to WT cells. Splicing defects were scored according to the presence or not of Beaf32 sites alone or together with dCTCF sites as indicated, both for defects identified as “retained introns” (RI) or for defects specifically associated with alternative splicing defects, identified as “exon skipped” (ES). The percentage indicate the number of genes with splicing defects over the total number of genes in each category, that is with Beaf32 and/or dCTCF sites or not, as measured upon Beaf- and dMes4-KD compared to WT control (mock-depleted) cells.

