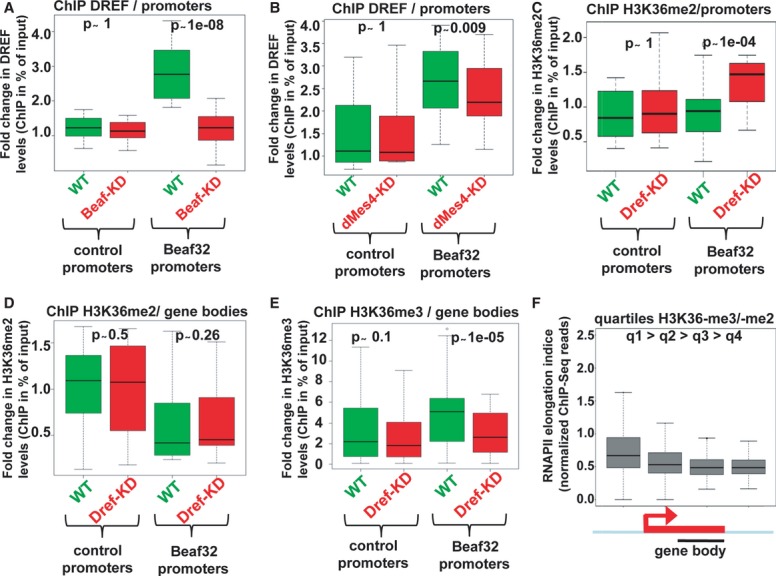
Figure 6. H3K36me3 deposition requires Beaf32/dMes-4-dependent recruitment of a transcriptional activator such as DREF.

- Box plot showing the results of ChIP experiments showing the DREF levels in Beaf32-KD (red boxes) compared to control cells (green boxes) in percent of input (y-axis) as obtained by performing ChIP with anti-DREF antibodies or IgG control and after normalization to three control loci (see Materials and Methods). Samples were analyzed by qPCR analyses in triplicates and for three independent measures in 16 control promoters or in Beaf32 bound promoters (see Materials and Methods for a list).
- Same as in (A) except that ChIP of DREF was performed in dMes4-KD (red boxes) compared to control cells (green boxes) for the same genes.
- ChIP of H3K36me2 in DREF-KD (red boxes) compared to control cells (green boxes) in percent of input (y-axis) for the same promoters as in (A) and (B).
- Same as in (C) except that levels were measured in the bodies of the same genes bound by Beaf32 or not.
- Same as in (D) except that ChIP was performed using anti-H3K36me3 or IgG antibodies for the same genes bound by Beaf32 or not.
- Box plot showing RNA polymerase II elongation indices as estimated by measuring the log ratio of ChIP-Seq reads found in gene bodies over reads in promoters (see Materials and Methods) as previously (Rahl et al, 2010). Genes were ranked according to the ratio of H3K36me3 over H3K36me2 levels as measured by ChIP-seq (q1/high to q4/low; see Materials and Methods).
