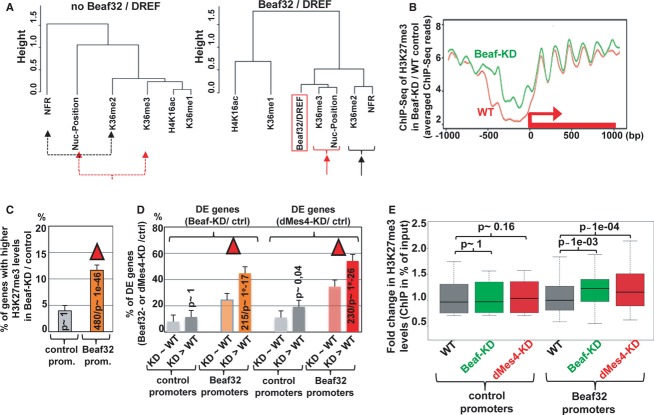
Dendogram representing the genome-wide correlations among distinct genomic features including H3K36 methylation and nucleosome positioning as a function of Beaf32/DREF binding (right) or not (left). The dendogram reflects the minimal variance (Ward distance) (see Materials and Methods) among all indicated genome-wide data by ChIP-Seq (Beaf32, H3K36me1/me2/me3 H4K16ac) or MNase-Seq (nucleosome positioning, NFR) after running principal component analyses for genes harboring Beaf32 binding sites or not. See also Supplementary Fig S9A.
Averaged H3K27me3 profiles for 990 promoter regions where most significant variations in H3K27me3 levels were scored between Beaf32-KD and control (WT) cells as measured by ChIP-Seq (see Materials and Methods). Note that such variations were systematically scored over ± 2 Kbp regions surrounding all Drosophila TSSs. See Supplementary Fig S10A for the H3K27me3 profiles of the complementary list of genes showing no variation in H3K27me3 levels upon Beaf32-KD.
Histogram representing the percentage of genes with increasing H3K27me3 levels in Beaf32-KD/WT (y-axis) depending on the presence or absence of a Beaf32 binding site in their promoters. See Supplementary Fig S10B for a similar analysis of control genes (with no variation in H3K27me3 levels).
Histogram showing the intersection analysis between the list of genes with variations in H3K27me3 levels (“Beaf32-KD > WT”; panel A) or not (“Beaf32-KD˜WT”; Supplementary Fig S10A) and the list of DE genes upon Beaf32-KD or dMes4-KD. The percentage of DE genes was scored depending on variations or not in H3K27me3 levels, for promoters with or without a Beaf32 binding site. See also Supplementary Fig S10C.
Box plot showing the fold changes in H3K27me3 levels as measured by qPCR of ChIP with anti-H3K27me3 antibodies or IgG control in dMes4-KD (red boxes), Beaf32-KD (green boxes) compared to control cells (grey boxes) normalized to input (y-axis). Samples were analyzed by qPCR analyses in triplicates and for three independent measures of Beaf32 bound promoters or control promoters (see Materials and Methods for a list). See also Supplementary Fig S10D for a correlation between Beaf32-KD and dMes4-KD.

