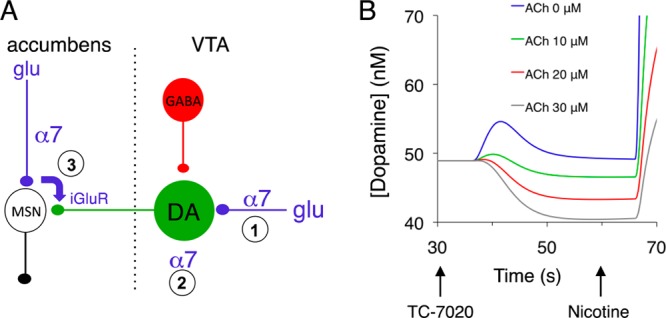
Figure 2.

Synaptic organization and responses of the “desensitization model”. Panel A shows a circuit diagram of the mesoaccumbal projection, highlighting the locations of those α7 NNRs that would evoke, through their desensitization, a drop in dopamine release. Panel B plots the extracellular dopamine dynamics in the model for four levels of cholinergic tone, indicated by their equivalent acetylcholine concentrations. The [TC-7020] profile is shown in Figure S2, Supporting Information, and TC-7020 reached a peak concentration of 11 nM. MSN, medium-sized spiny neuron; glu, glutamatergic afferent. For clarity, the α4β2* NNRs on the DA and GABA neurons or their afferents are not shown.
