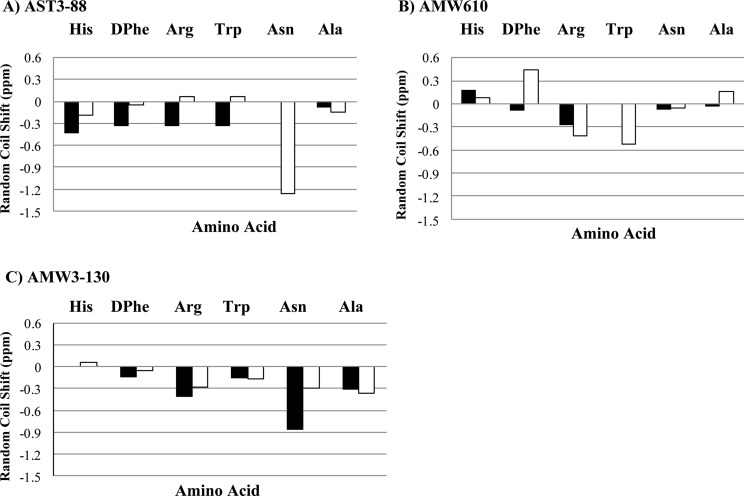
Figure 2.
Illustration of the compound deviation from random coil values for (A) AST3-88, (B) AMW610, and (C) AMW3-130.45 The HN and Hα protons are represented by solid bars and open bars, respectively. Vertical axes are in parts per million, and the horizontal axes represent the His-DPhe-Arg-Trp-Asn-Ala region of the peptide.

