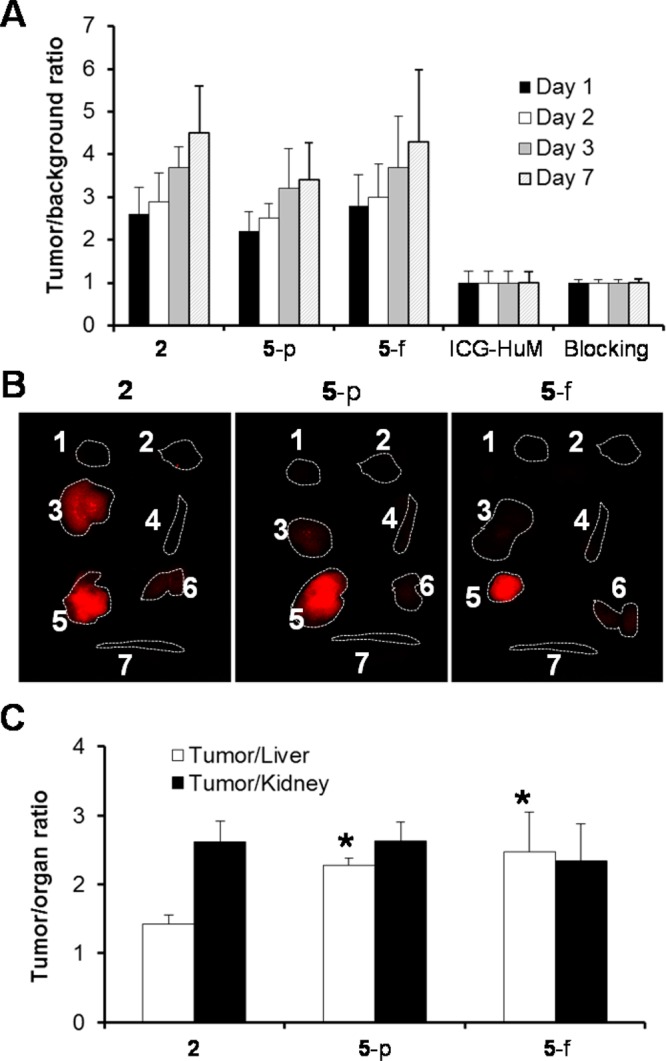
Figure 8.

(A) Comparison of tumor-to-background ratio with injection of SE-HPLC isolated 2 and after extraction by ethyl acetate 5 in athymic mice bearing HER1-positive s.c. LS-174T xenografts (n = 5). The dose of 5 was administered after normalization by the same protein (5-p, 20 mg) or fluorophore (5-f). (B) Representative ex vivo NIR fluorescence image of the dissected organs from mice above at day 3 after i.v. injection of doses. Labels: 1, heart; 2, lung; 3, liver; 4, spleen; 5, tumor; 6, kidney; 7, intestine. (C) Tumor-to-liver and tumor-to-kidney ratios obtained from the ex vivo imaging. *, significantly different from product 2 (P < 0.01).
