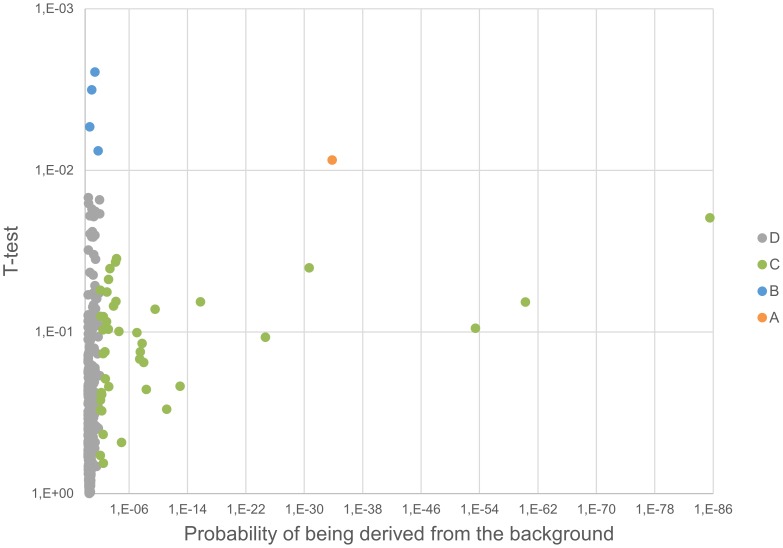
Figure 3. Volcano plot.
The significance of the relative regulation of 394 proteins was inspected using (1) a paired two-sided t-test (y axis) and (2) by estimating the probability for the regulation derived from the background (x axis). Proteins are clustered into four categories based on the statistical test passing the threshold (see text for details).

