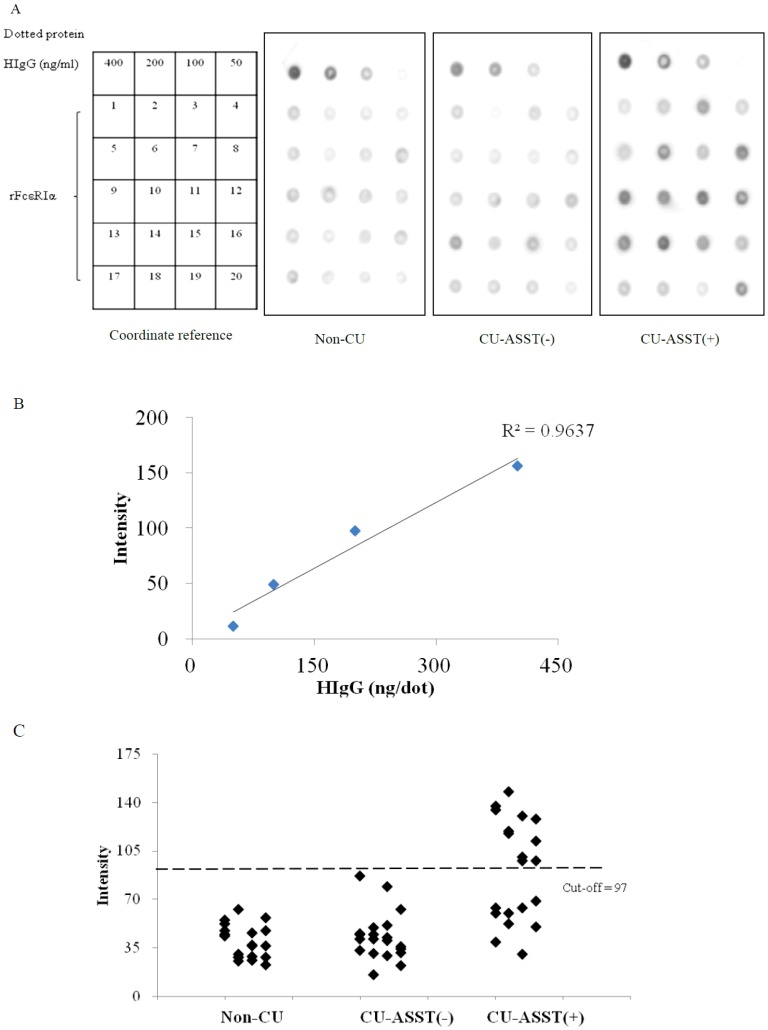
Figure 3. Dot-blot immunoassay of human IgG against recombinant FcεRIα.
(A) rFcεRIα was tested for reactivity toward serum IgG from 60 tested sera in the indicated groups. The diagram on the left showed the pattern of dotted proteins and coordinated serum number from each group on the blots. (B) Correlation curve of the human IgG (HIgG) concentrations and the intensity levels of dot signals by video densitometer. (C) Intensity levels of dot signals from (A). The cut-off value was 97 from the mean intensity of 200 ng HIgG, as shown by the dotted line.

