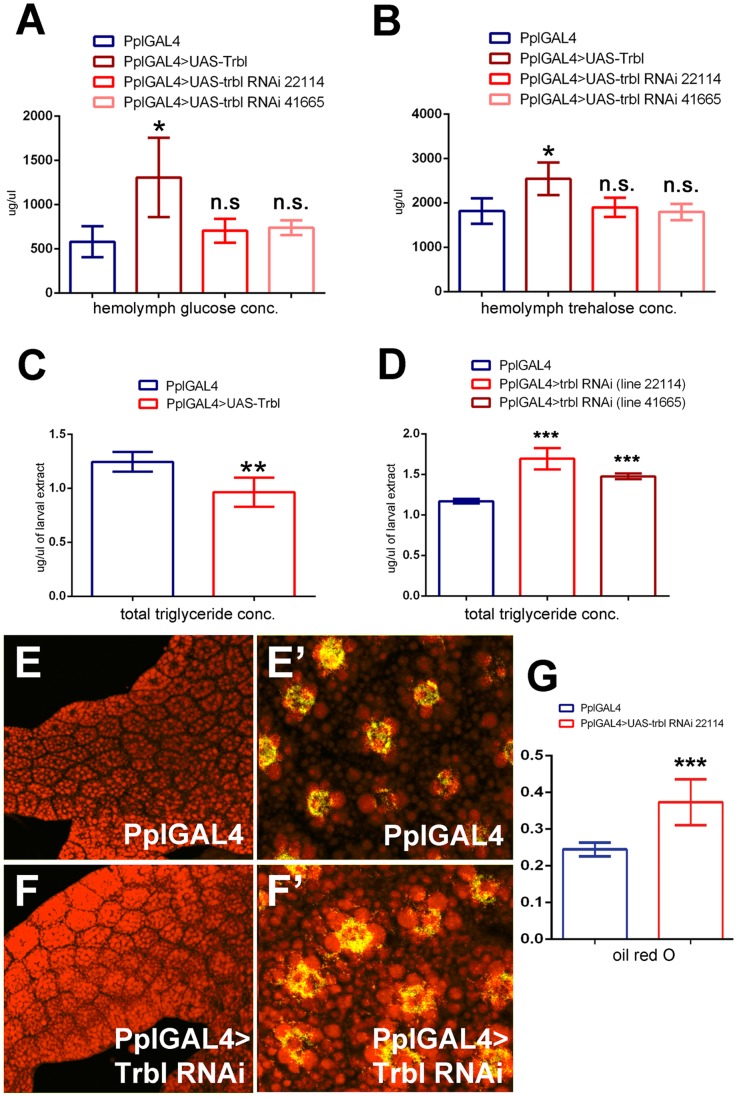
Figure 3. Trbl affects circulatory sugar and total lipid level.
(A). Compared to controls, Trbl overexpression in fat body increases hemolymph glucose level by ≈110% whereas trbl RNAi knock down does not alter glucose level significantly (in triplicate, n = 30/genotype). For panels A,D and G, n = 3 and n = 6 for C and P values from T test are indicated (n.s. = not significant; *P<0.05; **P<0.01; ***P<0.001) and are summarized in Table S1 and all error bars are ± S.D. (B). Compared to controls, hemolymph trehalose levels were significantly increased in larvae overexpressing Trbl in fat body but did not change significantly in trbl RNAi knock down larvae. (in duplicate, n = 30/genotype). (C). Compared to controls, overexpression of Trbl reduces total triglyceride level significantly by ≈22%. n = 6. (D). Compared to controls, misexpression of trbl RNAi line 22114 increased significantly total triglyceride level by ≈44% and for trbl RNAi line 41665 triglyceride levels were increased significantly by ≈25%. n = 3. (E,F). Trbl RNAi misexpression increases lipid accumulation. Nile red staining of dissected WT tissue (E,E′, DAPI in green) shows reduced lipid accumulation compared to fat body misexpressing Trbl RNAi (F,F′, line 21114). n = 3. (G). Fat body from PplGAL4 flies driving expression of Trbl RNAi (line 22114) shows a significant increase in Oil Red O binding (in arbitrary units) compared to fat body tissue dissected from control PplGAL4 flies. n = 3.

