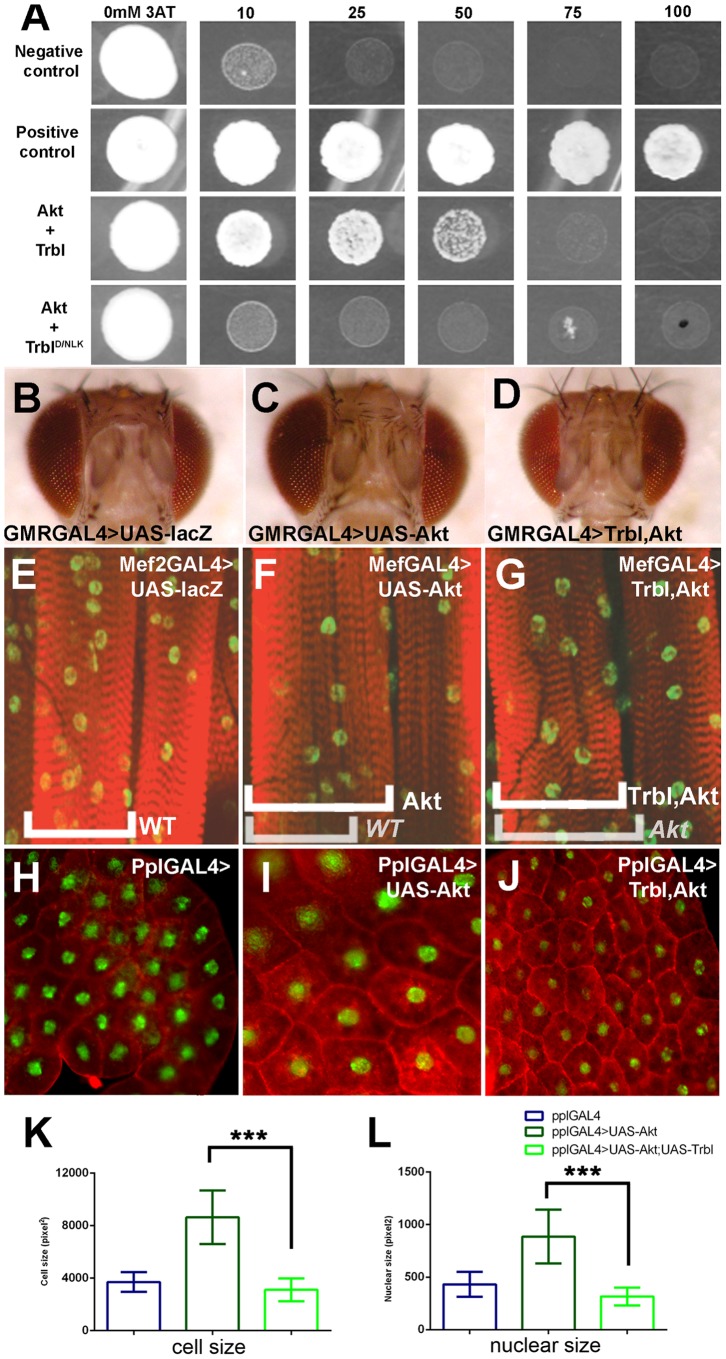
Figure 4. Trbl binds Akt and suppresses Akt-mediated cuticle growth phenotypes.
(A). The ability of yeast cells to grow on increasing concentrations of 3AT growth inhibitor depends on the strength of the protein-protein interaction. Yeast cells co-expressing Akt prey and WT Trbl bait are able to grow in presence of up to 50 mM 3AT whereas yeast cells co-expressing Akt and Trbl D/NLK bait are unable to grow in presence of 10 mM 3AT, similar to negative controls. (B–D). Akt misexpression in head capsule by the GMRGAL4 driver results in increased head size (C), which is effectively suppressed by Trbl co-misexpression (D). Genotypes: (B) GMRGAL4, (C) GMRGAL4>UAS-Akt1, (D) GMRGAL4>UAS-Akt1, UAS-Trbl. (E–G). Akt misexpression in the larval muscle using the MefGAL4 driver results in an increase in muscle size (cf. E,F) while Trbl effectively suppresses this (G). Genotypes: (E) Mef2GAL4, (F) Mef2GAL4>UAS-Akt1, (G) Mef2GAL4>UAS-Akt1, UAS-Trbl. (H–J). Age matched mid 3rd instar larval fat body cells from PplGAL4>UAS-Akt (I) are detectably larger that WT (H). This Akt-mediated increase in cell size is noticeably suppressed in fat body cells co-expressing Trbl and Akt (J). Tissues were stained with Phalloidin (red) to reveal cell boundary and DAPI (green) to reveal nucleus. Note that Fig 4B-D, E-G, H-J are taken under the same magnification, respectively. (K). Quantification of fat body cell size in pixels (n≈100 cells/genotype; for K and L, P values from two-tailed T test data are indicated (n.s. = not significant; *P<0.05; **P<0.01; ***P<0.001) and are summarized in Table S1 and all error bars are ± S.D. (L). Quantification of fat body nuclear size in pixels (n≈100 nuclei/genotype).

