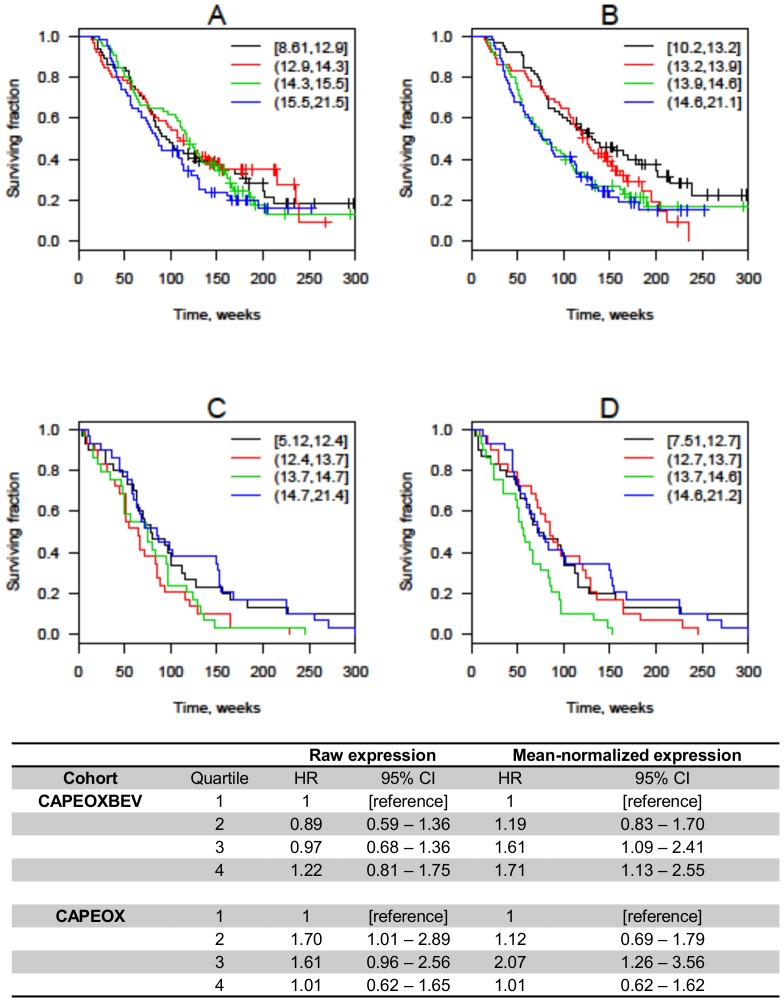
Figure 2. Overall survival according to quartiles of mir-455-5p expression.
Kaplan-Meier plots are shown for patients treated with CAPEOXBEV using raw (A) or mean-normalized (B) expression and patients treated with CAPEOX alone using raw (C) and mean-normalized (D) expression. Hazard ratios (HR) are unadjusted and confidence intervals (CI) are calculated using bootstrapping. The expression intervals shown in the upper right-hand corner are 40-Ct, so higher values correspond to higher expression. Black line = lowest quartile; red line = second quartile; green line = third quartile; blue line = highest quartile.

