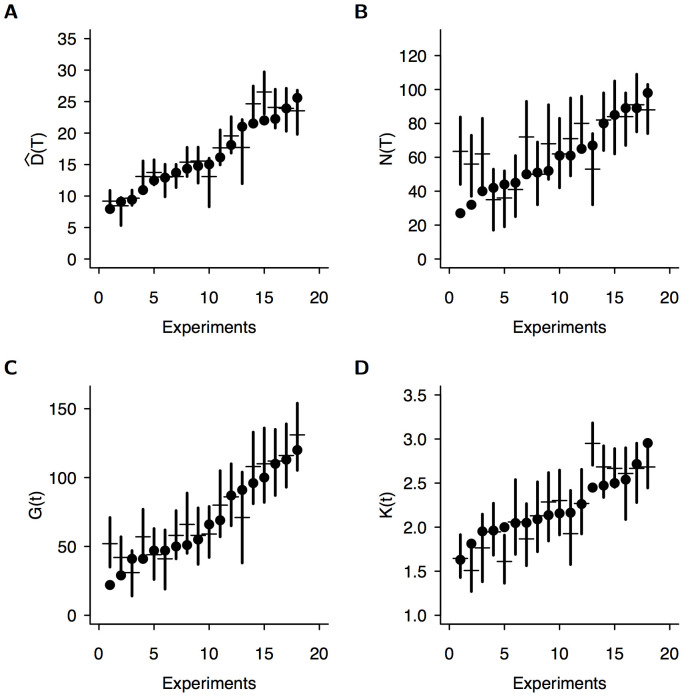
Figure 3. The structural properties of the observed networks at the end of experiments after three days (one symbol per experiment) are well predicted by the model for (a) the length  , (b) the number of nodes
  , (c) the number of tunnels
  and (d) the mean degree
  .
.
In each plot, vertical bars indicate 95% confidence interval predicted by the model and were numerically estimated using simulations (N = 2000 simulations per experiment using the corresponding set of behavioural parameters). Horizontal bars indicate the predicted median. Note that experiments have been ordered by increasing ordinate values.

