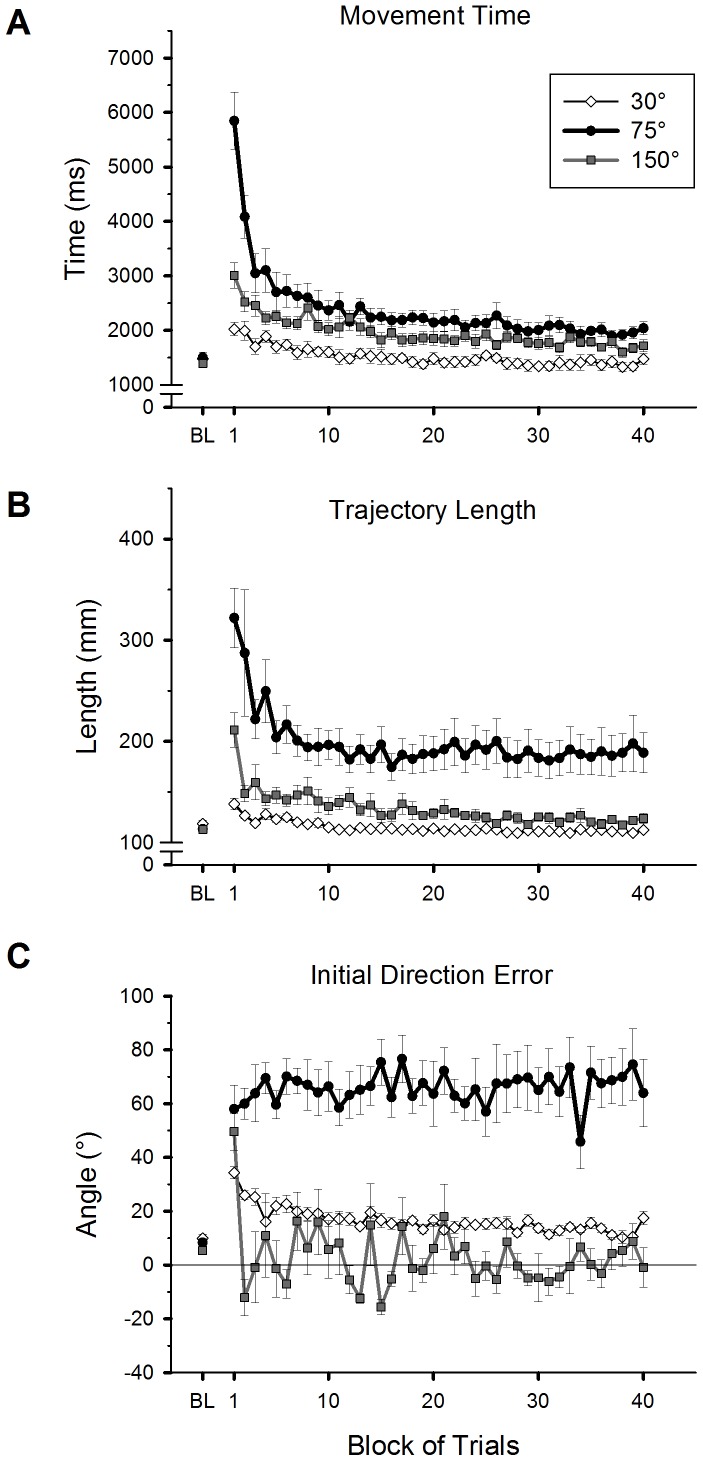
Figure 3. Adaptive changes of movement time (A), total trajectory length (B) and initial direction error (C) for hand movements during practice of a visuomotor rotation.
Mean values of all participants are plotted against 40 trial blocks with 4 trials each for the 30° (white diamonds), 75° (black circles), and 150° (grey squares) groups. Mean values from the baseline condition (BL) are also plotted. The error bars represent standard errors.

