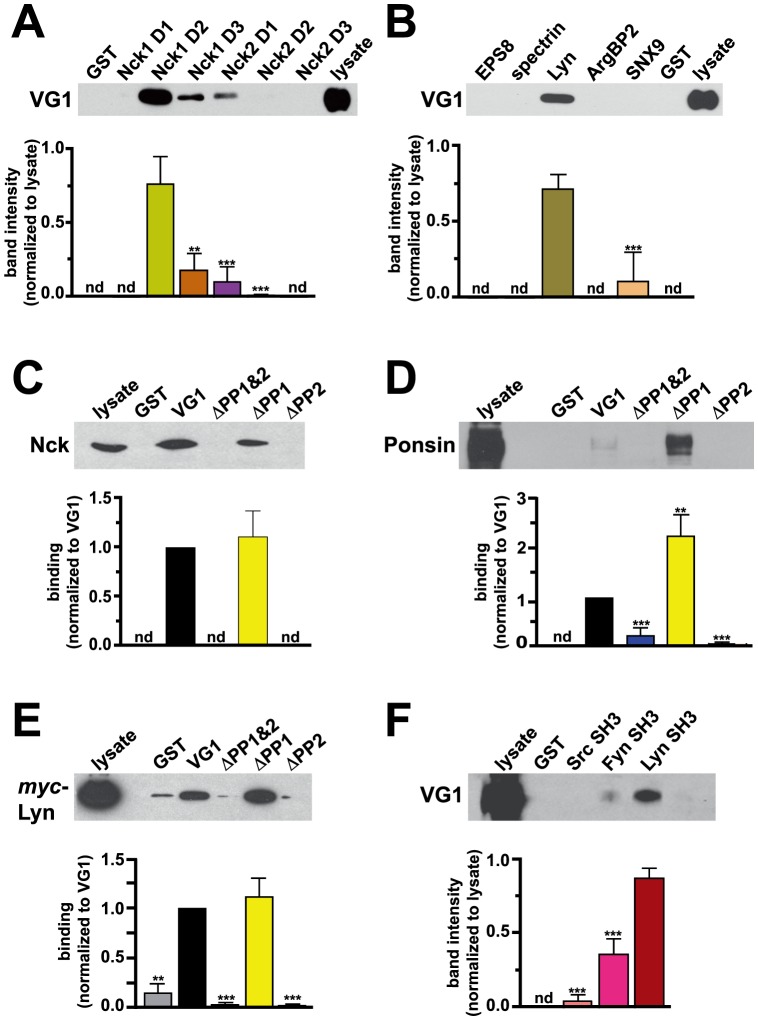
Figure 3. VGLUT1 interacts with SH3 domain-containing proteins in vitro.
(A, B) GST or GST fusions of SH3 domains from proteins identified in the array screen were incubated with rat brain extracts. Bound VGLUT1 was detected with specific antibody, quantified and expressed in arbitrary units (a.u.). (A) The three SH3 domains of Nck1 and 2 (D1-3) were screened independently. Interaction with VGLUT1 is strongest for the second SH3 domain of Nck1 (Nck1 D1 not detected; Nck1 D2, 0.7635±0.1104 a.u.; Nck1 D3, 0.1833±0.0649 a.u.; Nck2 D1, 0.1031±0.0595; Nck2 D2, 0.00976±0.00564 a.u.; Nck2 D3 not detected). (B) The SH3 domain of Lyn pulls down VGLUT1 from rat brain lysate (0.7182±0.0987 a.u.). No binding of VGLUT1 to the SH3 domains of EPS8, spectrin, or ArgBP2 was detected. Weak binding to SNX9 was detected in only one experiment (0.1107±0.1917 a.u.). (C, D) Rat brain extracts were incubated with GST or GST fusions of the VGLUT1 C-terminus (VG1), or VGLUT1 lacking both PP domains (ΔPP1&2), the first PP (ΔPP1) or second (ΔPP2). Both Nck (C) and ponsin (D) bound specifically to VG1 and ΔPP1, but not to ΔPP1&2 or ΔPP2 (Nck binding to ΔPP1: 1.114±0.261 a.u. Ponsin binding to: ΔPP1&2, 0.2249±0.1682 a.u.; ΔPP1, 2.243±0.447 a.u.; ΔPP2, 0.06198±0.03914 a.u.). (E) Extracts from COS7 cells transfected with myc-Lyn were incubated with GST or GST fusions of VGLUT1 as in (C, D). Binding to Lyn was detected with antibody to myc (ΔPP1&2, 0.03682±0.02458 a.u., ΔPP1, 1.119±0.189 a.u.; ΔPP2, 0.02823±0.01619 a.u.). (F) Rat brain extracts were incubated with GST or GST fusions of the SH3 domains of the kinases Src, Fyn, or Lyn. Immunoblots probed with antibody to VGLUT1 indicate specific binding to Lyn (0.8767±0.0644 a.u.) and significantly less to Fyn (0.3622±0.1034). Band intensities were quantified using ImageJ and normalized to lysate (A, B, F) or VG1 band (C, D, E). nd: not detected. Top panels show representative immunoblots, lower panels show the averaged quantification of band intensity from at least three independent experiments. **p<0.01, ***p<0.001, one-way ANOVA with Bonferroni's post-test.

