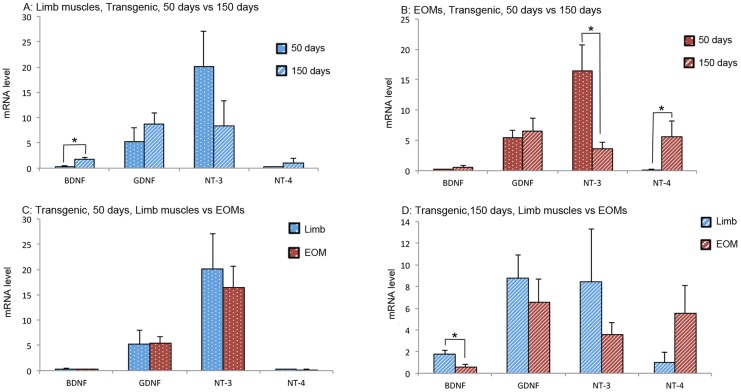
Figure 3. mRNA levels of NTFs in limb muscles and EOMs from early and late stage ALS mice.
Top panels: comparison of NTF expression in limb muscles (A) and EOMs (B) between early and late stages. Bottom panels: comparison of NTF expression between limb muscles and EOMs of early (C) and late stages (D). The expression levels are given using arbitrary units normalized by β-actin expression. Bars represent mean ± SD from analysis of at least 5 separate samples run in triplicate. *: p<0.05.

