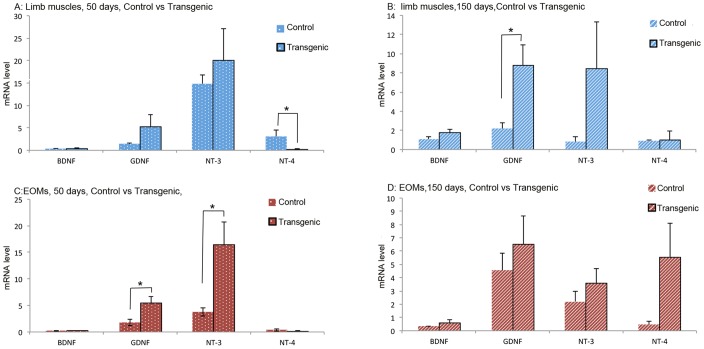
Figure 4. mRNA levels of NTFs in limb muscles and EOMs from early and late stages ALS mice and from age-matched control mice.
Top panels: comparison of NTF expression in limb muscles between ALS mice and control mice of 50 days (A) and 150 days of age (B). Bottom panels: comparison of NTF expression in EOMs between ALS mice and control mice of 50 days of age (C) and 150 days (D). The expression levels are given using arbitrary units normalized by β-actin expression. Bars represent mean ± SD from analysis of at least 5 separate samples run in triplicate. *: p<0.05.

