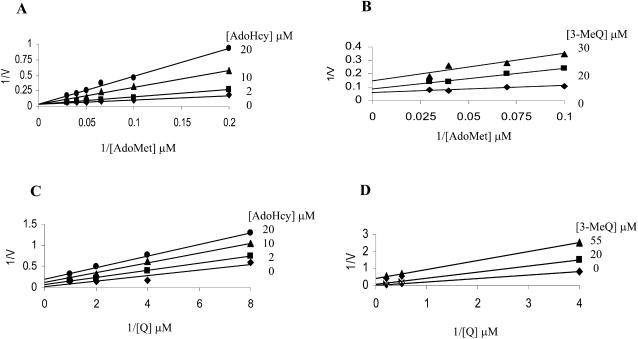
Figure 8.
Product inhibition patterns of the flavonol 3-OMT. A, 1/v versus 1/AdoMet at different fixed concentrations of AdoHcy and a constant concentration (5 μm) of Q. B, 1/v versus 1/Q at different fixed concentrations of AdoHcy and a constant concentration (60 μm) of AdoMet. C, 1/v versus 1/Q at different fixed concentrations of 3-MeQ and a constant concentration (60 μm) of AdoMet. D, 1/v versus 1/AdoMet at different fixed concentrations of 3-MeQ and a constant concentration (5 μm) of Q.

