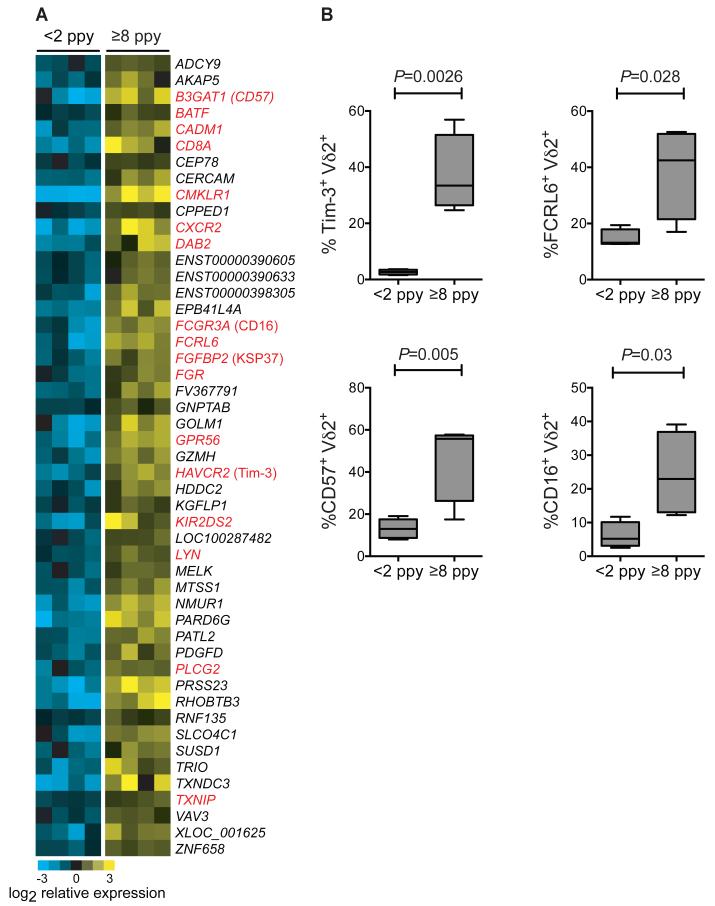
Fig.4.
Differential gene expression in unstimulated Vδ2+ T cells from children with low and high prior malaria incidence. (A) Whole transcriptome analysis of sort-purified unstimulated Vδ2+ γδT cells from children with <2 episodes ppy vs ≥8 episodes ppy (n=4 per group). Differentially expressed genes (determined using a 5% false discovery rate (FDR), fold change ≥ 2 with two-class unpaired comparisons) are depicted as a heat map of relative expression intensities, log2 normalized to the median expression across all samples for each gene. Yellow represents higher and blue represents lower expression relative to the median; gene names depicted in red represent genes with previously reported roles in tolerance or immunoregulation, with common protein names provided in parentheses following the official gene symbol. (B) Flow cytometric analyses confirming increased expression of immunoregulatory proteins in children with high prior malaria incidence. (n=4-5 per group, Wilcoxon rank-sum. See table S1 for individual data).

