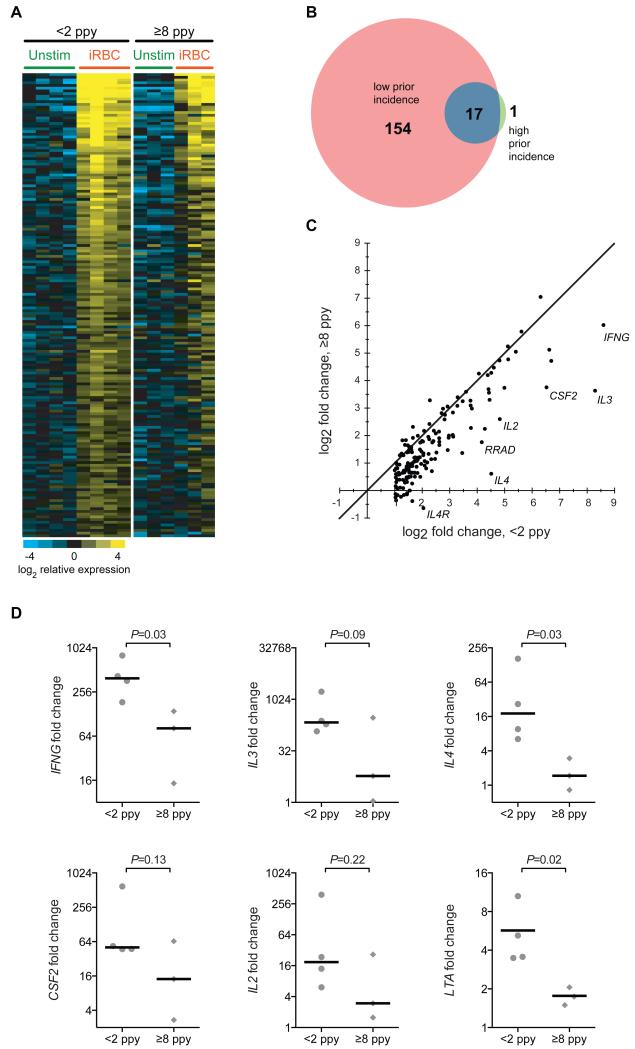
Fig 5.
Diminished gene induction in Vδ2+ T cells following P. falciparum stimulation in children with high prior malaria incidence. (A) Shown are relative gene expression of significantly induced genes before and after stimulation with iRBCs in children with low prior incidence (n=4, left set of columns, determined using 5% FDR, fold change ≥ 2, two-class paired comparisons). Relative Vδ2+ gene expression before/after iRBC stimulation in children with high prior incidence shown for comparison (n=3, right set of columns; one paired sample not analyzed due to amplification failure in stimulated sample). (B) Venn diagram showing number of significantly induced genes following iRBC stimulation in low and high prior incidence children. The full list of significantly induced genes is available in table S2. (C) Significantly induced genes from (A) plotted as fold change gene induction (stimulated/unstimulated) in high prior incidence versus low prior incidence. The identity line (m = 1) is shown. The seven genes with the largest residuals from the identity line are labeled. (D) Fold change gene induction (stimulated/unstimulated) of Vδ2+ T cells of the six most significantly induced cytokines in children with low (left, n=4) and high (right, n=3) prior incidence (t test of log2-transformed fold changes.)

