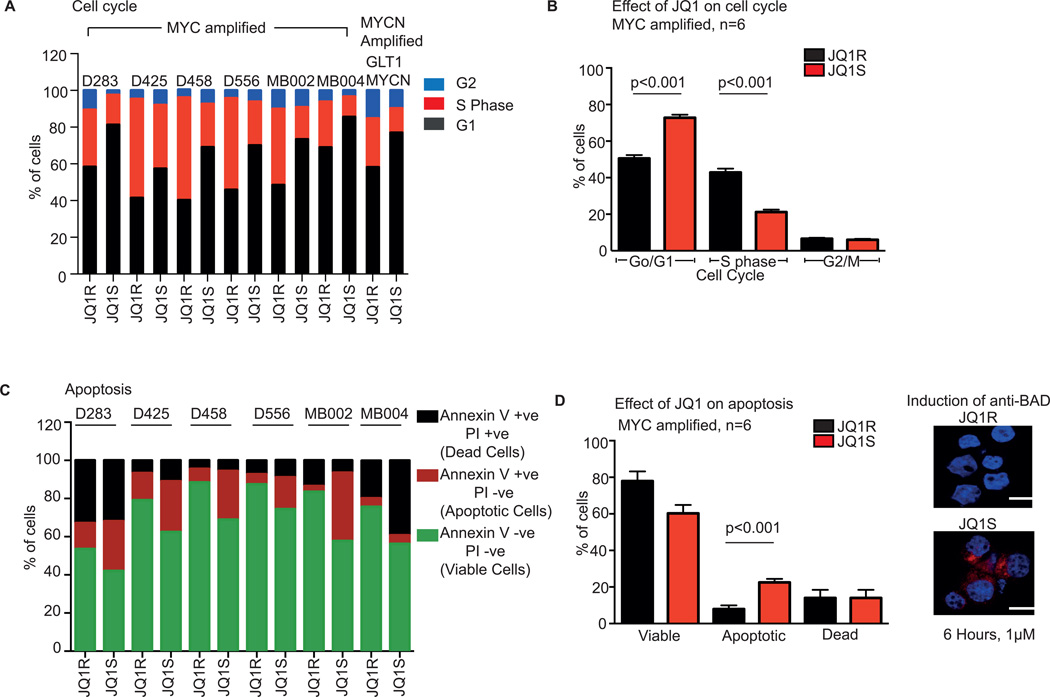
Figure 3. JQ1 induces G1 arrest and apoptosis in patient-derived MYC-amplified medulloblastoma cell lines.
A Cell cycle analysis of MYC amplified patient medulloblastoma cell lines and one MYCN amplified cell line derived from a GEMM treated with 1µM of JQ1S and JQ1R for 72 hours
B Pooled cell cycle analysis of MYC amplified medulloblastoma cell lines treated with 1µM of JQ1S and JQ1R for 72 hours. Values represent mean ± SD. ANOVA p value<0.001.
C Annexin V/PI apoptosis assays of MYC amplified medulloblastoma cell lines treated with 1µM of JQ1S and JQ1R for 72 hours. Viable cells are negative for annexin V and PI, apoptotic cells are positive for Annexin V and negative for PI and dead cells are positive for both Annexin V and PI.
D, Pooled Annexin V/PI apoptosis analysis of the six MYC-amplified medulloblastoma cell lines following treatment with 1µM of JQ1S and JQ1R for 72 hours. Values represent mean ± SD. Images on right shows induction of the apoptotic protein, BAD, in MB002 cell line, six hours following treatment with 1µM of JQ1S. Scale shown represents 20 micron.

