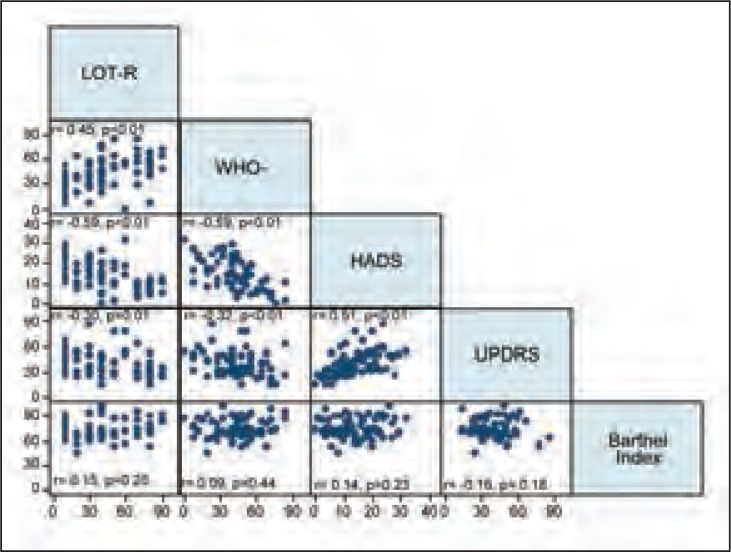
Figure 1.
Correlation of LOT-R values with the other study variables.
r=coefficient from Pearson’s correlation analysis; statistically significant correlation: p<0.05
LOT-R= Life Orientation Test-Revised version; WHO-5= WHO-5 Well-being Index; HADS=Hospital Anxiety and Depression Scale; UPDRS=Unified Parkinson’s Disease Rating Scale

