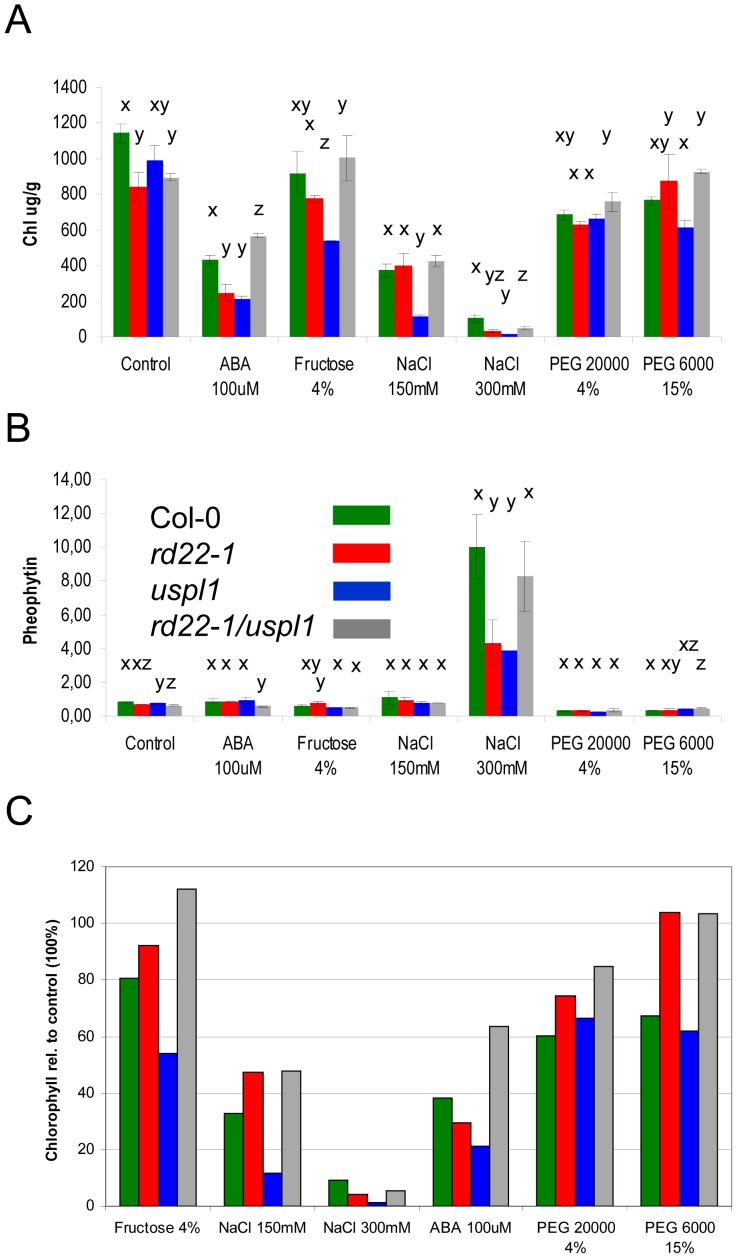
Figure 4. Chlorophyll and pheophytin content in single and double BURP mutants.
The bars represent the total A) chlorophyll and B) pheophytin content in leaves from wild type (Col-0, green bar), single and double mutant plants (rd22-1, red bar, uspl1, blue bar and rd22-1/uspl1, grey bar). Chlorophyll a and b was determined separately (Figure S6A) and subsumed as total chlorophyll content. Error bar represents standard error. N = 5–6 plants in duplicate. Statistical analysis was performed by oneway ANOVA at alpa = 0.05 Tukey post hoc test: same letters indicate no difference, different letters indicate significant difference. C) The bars show the total chlorophyll content [%] relative to unstressed control plants.

