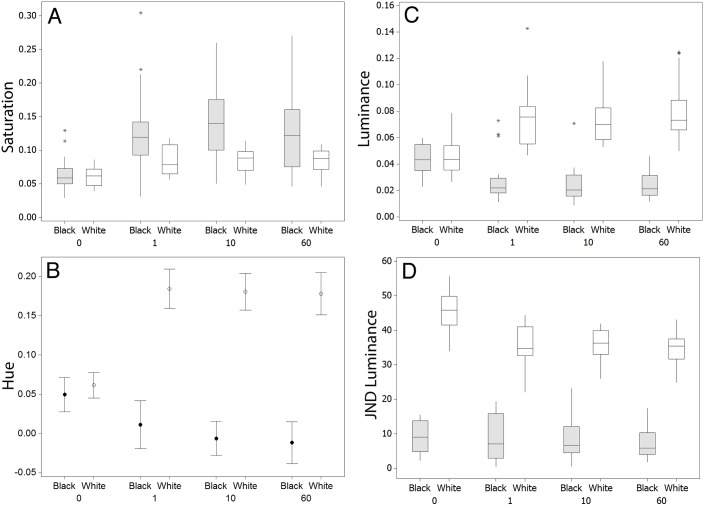
Figure 1. Changes in the different colour and achromatic metrics for fish on black and white backgrounds in experiment 1 for saturation (A), hue (B), and luminance (C) at the start (0 minutes) of the experiment and at 1, 10, and 60 minutes.
Panel D shows the level of similarity for fish against the white and black backgrounds for JNDs in luminance (see main text) at 0, 1, 10, and 60 minutes. Graphs A, C, and D show medians plus inter-quartile range (IQR), whiskers are lowest and highest values that are within 1.5*IQR from the upper and lower quartiles, asterisks represent outliers. B shows means plus standard error.

