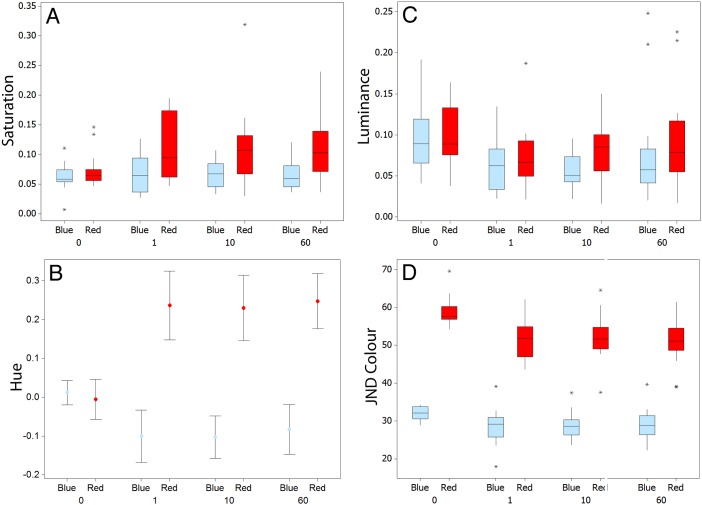
Figure 2. Changes in the different colour and achromatic metrics for fish on red and blue backgrounds in experiment 2 for saturation (A), hue (B), and luminance (C) at the start (0 minutes) of the experiment and at 1, 10, and 60 minutes.
Panel D shows the level of similarity for fish against the red and blue backgrounds for JNDs in colour at 0, 1, 10, and 60 minutes. Graphs A, C, and D show medians plus inter-quartile range (IQR), whiskers are lowest and highest values that are within 1.5*IQR from the upper and lower quartiles, asterisks represent outliers. B shows means plus standard error.

