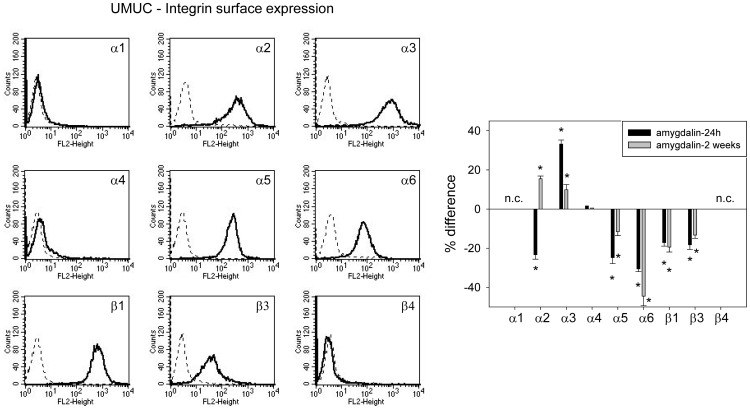
Figure 4. FACS analysis of integrin α and β subtype expression on UMUC-3 cells.
The left panel depicts integrin expression as histogram plots with a dotted line indicating background fluorescence and a solid line indicating specific fluorescence in untreated cells. The right panel shows integrin subtype expression after 24 h and 2 weeks amygdalin exposure, compared to controls set at 100%. n.c. = not calculated. * indicates significant difference to controls.

