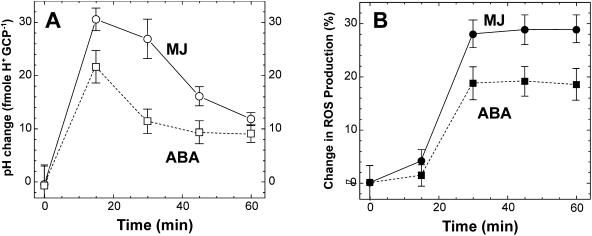
Figure 5.
Kinetics of pH change (A) and ROS production (B) in guard cells in response to 20 μm ABA or 20 μm MJ; pH changes (A) were determined using the null-point method and H2O2 production (B) using the fluorescent dye H2DCF-DA as described in “Materials and Methods”. Each data point is the mean ± se from at least 3 independent experiments.

