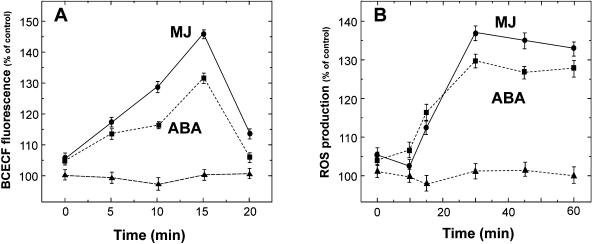
Figure 6.
The pH changes and ROS production in guard cells of P. sativum. Changes in pH (A) or ROS (B) were monitored by using BCECF-AM or H2DCF-DA after the addition of ABA (squares) and MJ (circles). The pixel intensities of fluorescence at each given point were determined and the relative changes in pH or ROS production were expressed by considering solvent control at zero time as the standard (100%). Each data point is the mean ± se from at least 3 independent experiments. Note the different time scales in A and B.

