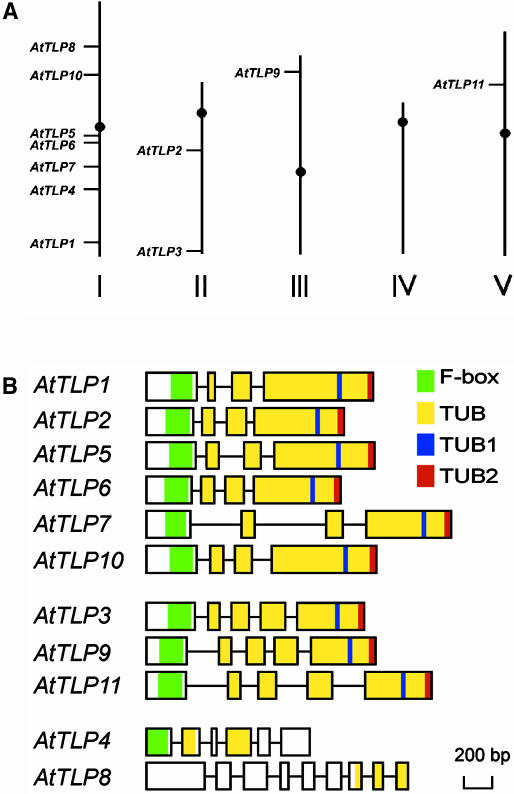
Figure 2.
Location and gene structure comparison of the AtTLP gene family. A, Chromosomal locations of the AtTLP genes. The relative sizes of five Arabidopsis chromosomes are derived from the National Center for Biotechnology Information database. B, The intron-exon structure of the AtTLP gene family. Except for AtTLP4, the positions of the exons/introns of each individual AtTLP gene were confirmed by comparison of the cDNAs with their corresponding genomic DNA sequences. Exons and introns are represented by boxes and lines, respectively. The green and yellow shaded boxes indicate approximate positions encoding the F-box and tubby domain of the AtTLPs. Two PROSITE signature patterns (TUB1 and TUB2 motif) in tubby domain are shown in blue and red shaded boxes, respectively. The scale shown below is in base pairs.

