Figure 6.
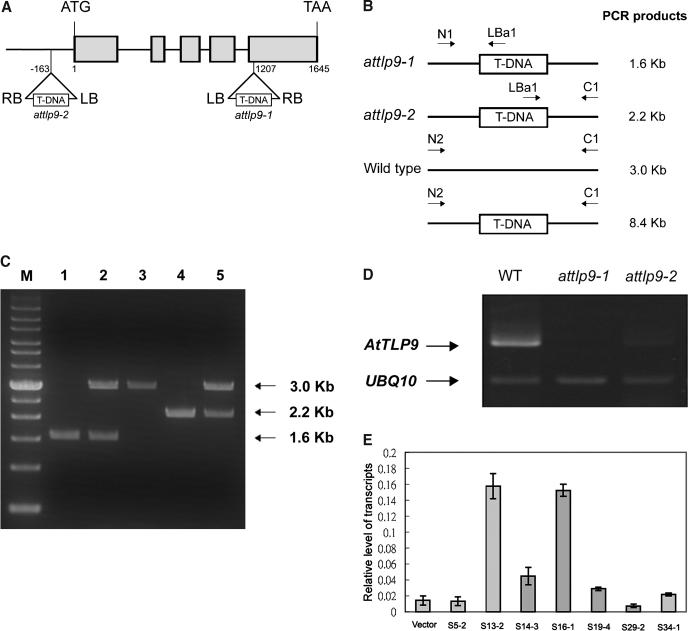
Molecular characterization of AtTLP9 T-DNA insertion lines. A, Schematic presentation of the structure of the AtTLP9 genomic structure. Start ATG and termination codons are indicated. The five exons are represented by gray boxes. The T-DNA location for each of the two attlp9 knockout lines, attlp9-1 and attlp9-2, are indicated. B, Schematic diagrams of the attlp9-1 and attlp9-2 genotyping: N1, forward primer of AtTULP9; LBa1, left-border primer of T-DNA; and C1, reverse primer of AtTLP9. The N1 and LBa1 primers produced the 1.6-kb PCR fragment from the attlp9-1 genomic DNA, and C1 and LBa1 primers produced the 2.2-kb PCR fragment from the attlp9-2 T-DNA genomic DNA; N2 and C1 primers produced a 3.0-kb PCR product from the wild-type DNA, while no PCR band was obtained from the attlp9-1 and attlp9-2 genomic DNA because the expected fragment was too large to amplify. C, Genotype determination for attlp9-1 and attlp9-2. Lane 1, homozygous attlp9-1; lane 2, heterozygous attlp9-1; lane 3, wild type; lane 4, homozygous attlp9-2; and lane 5, heterozygous attlp9-2. M, Mr marker. Size of major PCR products was indicated in kilobase pairs. D, Examination of AtTLP9 transcript in attlp9-1 and attlp9-2 plants. RT-PCR was performed with total RNA extracted from 14-d-old seedlings of attlp9-1, attlp9-2, and the wild type (Col-0) as described in “Materials and Methods.” UBQ10-specific primers were also included as an internal control. E, mRNA level for AtTLP9 gene in 14-d-old seedlings of AtTLP9 sense transgenic plants. Total RNA was extracted from 14-d-old seedlings of vector control and seven independent T3 sense homozygous transgenic plants. Poly(A+) mRNA was isolated, converted to cDNA, and subjected to real-time PCR analysis as described in “Materials and Methods.” Transcript levels are given as relative values to UBQ10 (the value of 1). Each data point represents the mean of triplicate experiments. The small bars represent se. Vector represents transgenic plants carrying the empty vector.

