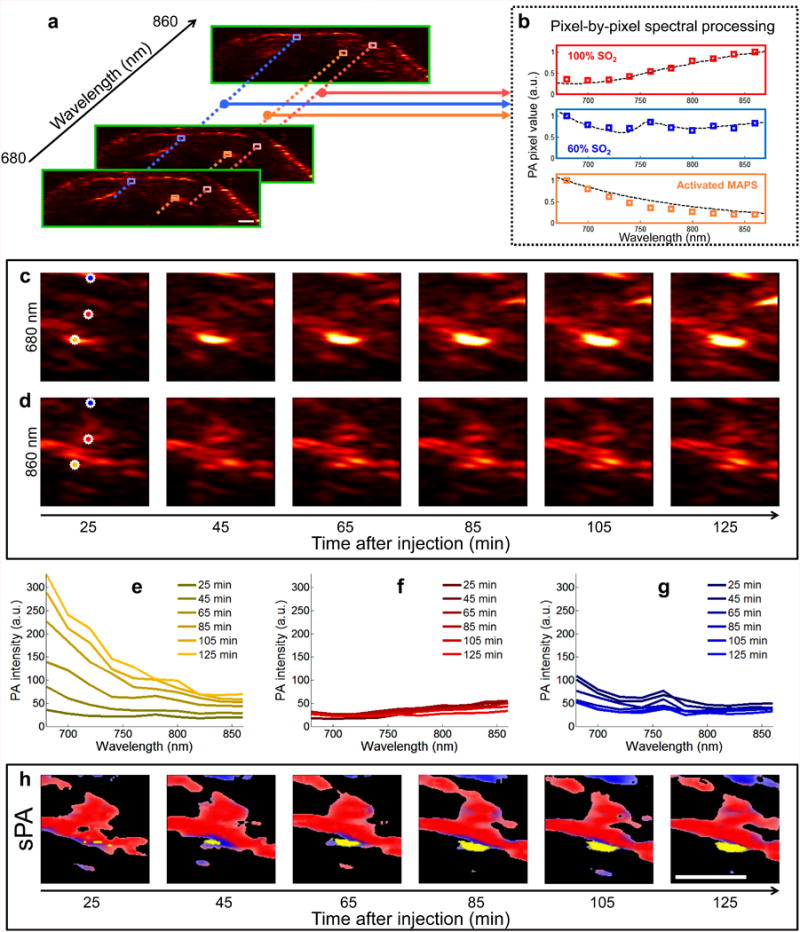
Fig. 2.

Generation of sPA images. (a) In each two-dimensional plane PA images are acquired using excitation wavelengths spanning 680 nm to 860 nm in steps of 20 nm. (b) Each pixel is compared to hemoglobin and activated MAPS; the dashed lines represent the expected spectra, while the colored boxes are representative measured PA signals. Spectral unmixing is performed using a least squares method (29). An example of spectral unmixing of a series of PA images is shown in (c-h). Photoacoustic images acquired at (c) 680 nm and (d) 860 nm show the raw of PA signal. (e-g) The spectra derived from three pixels (denoted by orange, red, and blue stars, for (e), (g), and (g), respectively) of the PA images acquired at 10 wavelengths, including the images from (c) and (d), exhibit distinct spectral signatures which correlate well with the spectra of hemoglobin or MAPS. The pixel containing signal correlating to the MAPS spectrum steadily increases in amplitude over time (e), while the signals corresponding to blood remain relatively constant (f and g). (h) After spectral unmixing, the different absorbers are clearly distinguished as either blood (red/blue) or activated MAPS (yellow). Scale bars are 1 mm.
