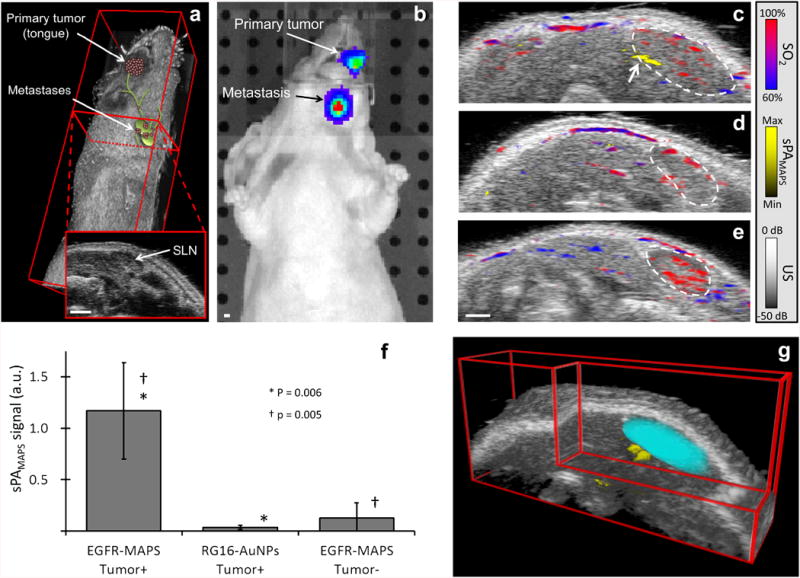
Fig. 3.

In vivo imaging of lymph node micrometastases. (a) Three-dimensional US image of a mouse with an overlaid cartoon of the primary tumor in the tongue and micrometastases in the cervical lymph nodes. The inset shows a two-dimensional cross section of the US image with a lymph node seen as the dark, hypoechoic bean-shaped region. (b) A representative bioluminescence image confirms the presence of FaDu cells in the primary tumor and in the lymphatic system. Representative overlaid US and sPA images of: a tumor-bearing mouse with a lymph node metastasis two hours after a peritumoral injection of either (c) EGFR-targeted MAPS or (d) control RG16-conjugated AuNPs and (e) a normal mouse two hours after a submucosal injection of EGFR-targeted MAPS. Hemoglobin (sPAHb) is depicted in red-blue, as determined by the oxygen saturation, while the presence of cancer cells labeled with MAPS (sPAMAPS) is depicted in yellow (see an arrow pointing to a micrometastasis in (c)); the anatomical location of a cervical lymph node is outlined by a dashed white line. Note the strong sPAMAPS signal in tumor-bearing mice injected with EGFR-targeted MAPS. (f) The LNs were split into three categories for analysis: 1) LNs containing metastases in mice injected with EGFR-targeted MAPS (N = 7), 2) LNs in tumor bearing mice injected with RG16-conjugated AuNPs (N = 7), and 3) LNs without metastasis in mice with or without a primary tumor injected with EGFR-targeted MAPS (N = 8). The total signal of activated MAPS was used as indictor of metastases. The metastatic lymph nodes in tumor-bearing mice exhibit a statistically significant increase in the sPAMAPS signal. The p values are from a Mann-Whitney U test and error bars correspond to one standard deviation. (g) A three-dimensional reconstruction of the US images with the SLN volume segmented from the two-dimensional US images (cyan) with the overlaid three-dimensional sPA image showing the volumetric distribution of the sPAMAPS signal. All scale bars are 1 mm.
