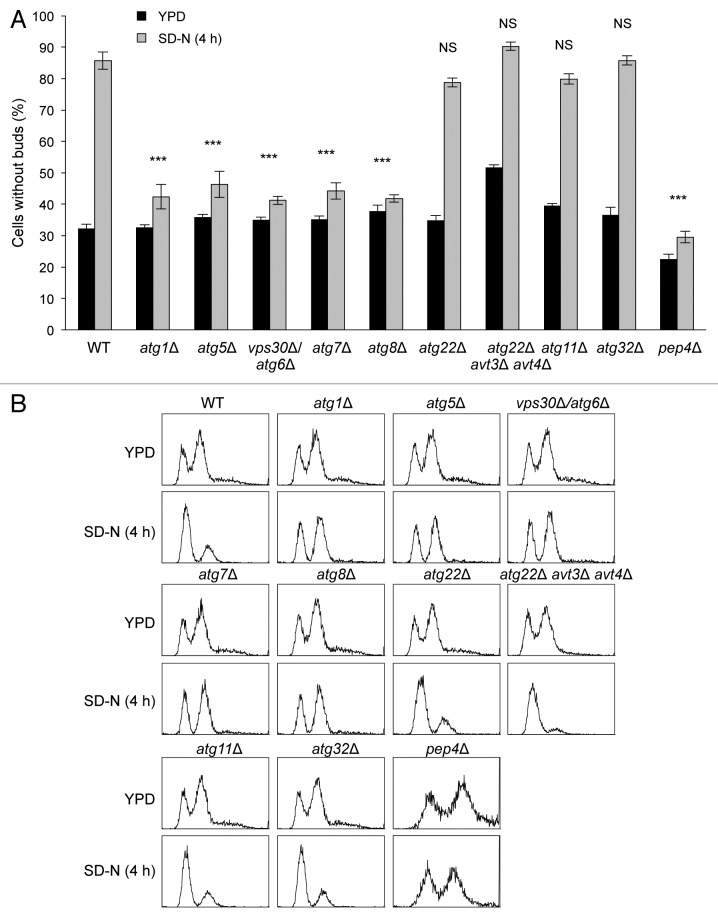
Figure 1. Cell-cycle analysis of wild-type and autophagy-deficient yeasts during nitrogen starvation. (A) Quantification of the percentage of wild-type and indicated atg mutant yeast strains without buds at time 0 (YPD) or after 4 h in SD-N (SD-N). Bars represent mean ± SEM of triplicate samples (at least 100 cells per sample were counted). Similar results were observed in more than 3 independent experiments. ***P < 0.001, NS, not significant; 2-way ANOVA with Bonferroni correction for comparison of magnitude of change between YPD and SD-N in the indicated atg mutant yeast strain compared with the magnitude of change between YPD and SD-N in wild-type (WT) yeasts. (B) FACS analysis of cell cycle of the indicated yeast strains at time 0 (YPD) or after 4 h in SD-N (SD-N). 10,000 cells were analyzed per strain. Similar results were observed in more than 3 independent experiments.

An official website of the United States government
Here's how you know
Official websites use .gov
A
.gov website belongs to an official
government organization in the United States.
Secure .gov websites use HTTPS
A lock (
) or https:// means you've safely
connected to the .gov website. Share sensitive
information only on official, secure websites.
