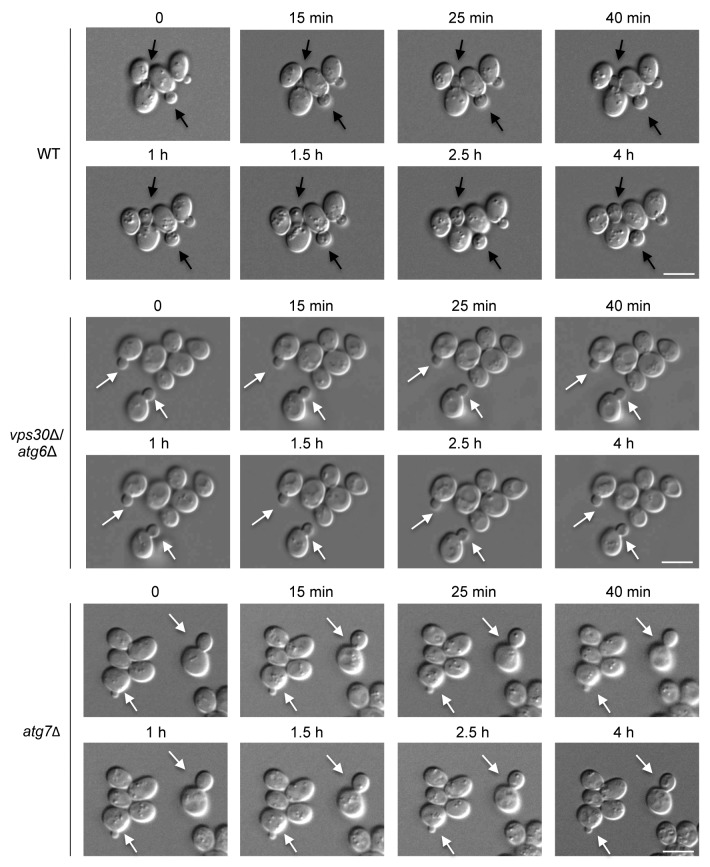
Figure 3. Autophagy-deficient yeasts fail to complete cell division after nitrogen starvation. Yeasts were grown on an SD-N agarose pad and images were taken at serial time points using a Zeiss Axioplan 2 microscope. The time above each image indicates the time in nitrogen starvation (SD-N). Black arrows denote buds that separate to become daughter cells during the imaging period. White arrows denote buds that fail to separate to become daughter cells during the imaging period. Scale bar: 5 μm. At least 15 cells were examined per time-lapse photography experiment and similar results were observed in 5 different experiments.

An official website of the United States government
Here's how you know
Official websites use .gov
A
.gov website belongs to an official
government organization in the United States.
Secure .gov websites use HTTPS
A lock (
) or https:// means you've safely
connected to the .gov website. Share sensitive
information only on official, secure websites.
