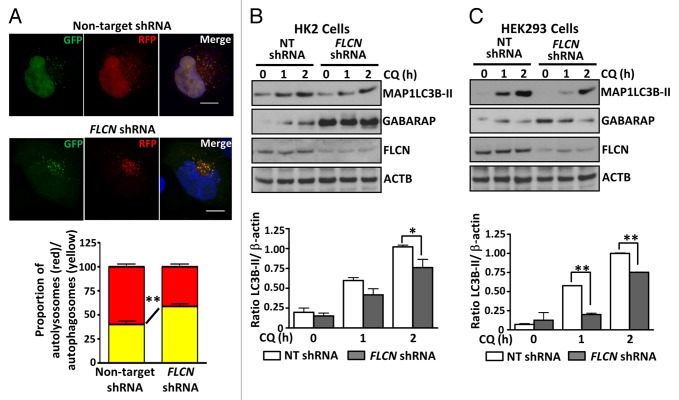
Figure 2. FLCN is a positive driver of autophagy. (A) HK2 control and FLCN knockdown cells were transfected with the ptfMAP1LC3B vector, fixed, and examined by confocal microscopy. Representative maximal Z-projection images of cells showing the RFP-GFP-MAP1LC3B puncta are shown in the upper panel. Scale bar: 10 μm. Red and yellow puncta were scored across 3 independent experiments (at least 30 cells per cell line in total) and are plotted below the images, mean ± SEM (B) Control HK2 cells and those with stable knockdown of FLCN were treated with 100 μM chloroquine (CQ) for the indicated times. Samples were probed for conversion of MAP1LC3B (graphed in panel below, mean ± S.E.M.) and GABARAP expression. (C) As for (B) but in HEK293 cells with transient knockdown of FLCN expression. For all graphs *P < 0.05, **P < 0.01.

An official website of the United States government
Here's how you know
Official websites use .gov
A
.gov website belongs to an official
government organization in the United States.
Secure .gov websites use HTTPS
A lock (
) or https:// means you've safely
connected to the .gov website. Share sensitive
information only on official, secure websites.
