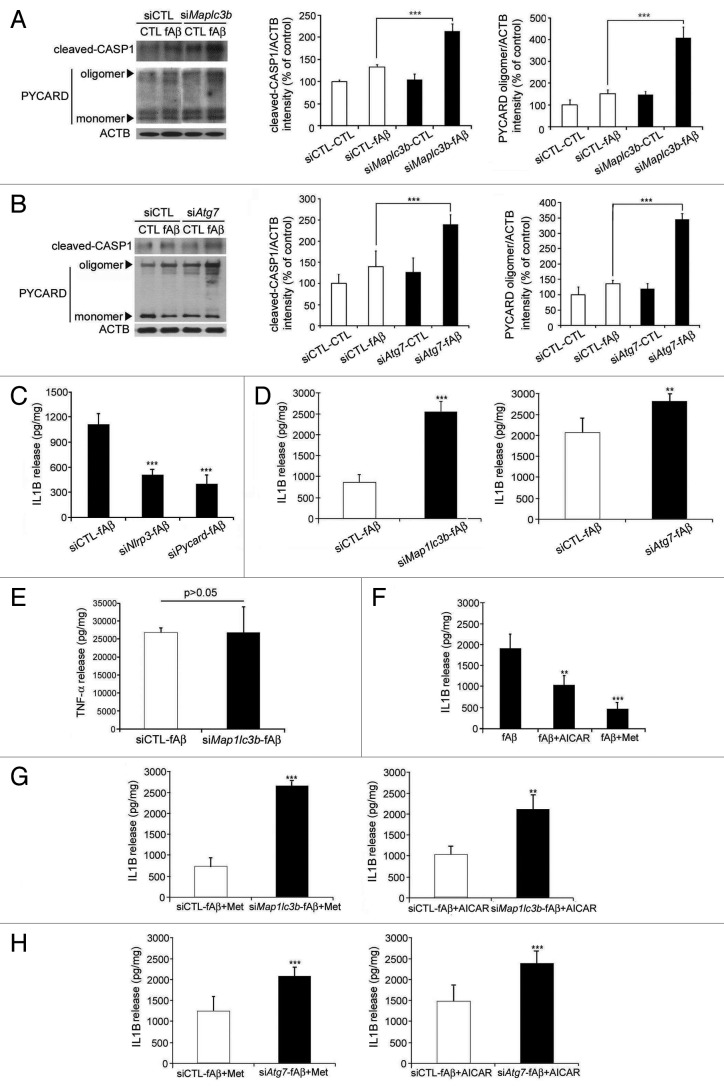
Figure 4. Increased inflammation following the disruption of microglial autophagy. (A and B) Primary mouse microglia were transfected with the indicated siRNAs and treated with Aβ fibrils (1 μM). Levels of cleaved CASP1 and PYCARD oligomerization were increased in microglia following the addition of fAβ; these levels were even higher following the knockdown of Map1lc3b and Atg7. The bar graphs show the densitometric quantification of the immunoblot bands. Each graph displays the band densities of the indicated immunoreactive protein as expressed as a percentage of the siCTL controls (100%). Data are presented as the means ± SEM of 3 independent experiments and were analyzed using the Student t test. ***P < 0.005 vs. control. (C–E) Primary mouse microglia were transfected with the indicated siRNAs and preactivated with LPS (1 ng/mL) for 3 h before the Aβ fibrils (1 μM) were added. The levels of IL1B and TNF were measured in the supernatant fractions of the microglia 24 h later using ELISA. (F–H) Primary mouse microglia were transfected with the indicated siRNAs and preactivated with LPS were treated with AICAR or metformin 30 min before the Aβ fibrils (1 μM) were added. The IL1B level was measured in the supernatants of the microglia 24 h later using ELISA. The decrease in IL1B by AICAR or metformin was not observed following the knockdown of Map1lc3b or Atg7. Data are presented as the means ± SEM of 3 independent experiments and were analyzed using the Student t test. **P < 0.01, ***P < 0.005 vs. control.

An official website of the United States government
Here's how you know
Official websites use .gov
A
.gov website belongs to an official
government organization in the United States.
Secure .gov websites use HTTPS
A lock (
) or https:// means you've safely
connected to the .gov website. Share sensitive
information only on official, secure websites.
