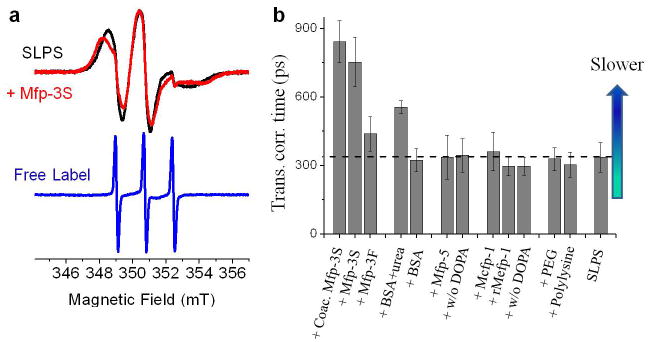
Figure 2.

(a) ESR spectra of SLPS before (black) and after addition of Mfp-3S (slow) (red) in MES buffer, pH 3.0 and 20°C. ESR spectrum of free 4-carboxy TEMPO in MES buffer and pH 3.0 (blue). (b) Translational correlation time (τsurface-water) of hydration water at the surface of SLPS before and after addition of (2.5 mg/mL) Mfp-3S, Mfp-3F (fast), 5 M urea induced BSA, Mfp-5, rMfp-5 without Dopa, rMefp-1, rMefp-1 without DOPA, 4.5 kDa PEG, poly-L-lysine in MES buffer, pH 3.0 and coacervated Mfp-3S in MES buffer, pH 5.5. The horizontal dashed line marks the reference τ value of the bare SLPS surface. Higher τ values reflect slower hydration water motion. Error bar represents the standard deviation.
