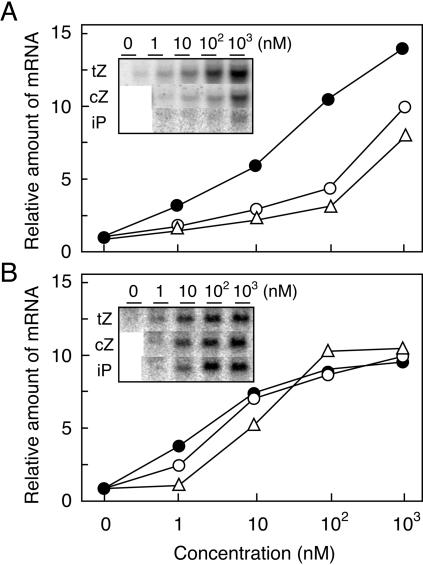
Figure 5.
Effects of tZ and cZ on ZmRR expression. Total RNA (20 μg), prepared from maize leaves treated with the indicated concentration of tZ, cZ, or iP for 120 min (A), or from maize cultured cells treated for 20 min (B), was subjected to electrophoresis on agarose gels and transferred to nylon membranes. The blots were treated with a 32P-labeled probe specific for ZmRR1. A probe for ubiquitin mRNA was used as an internal control (data not shown). The signal intensity of the ZmRR1 transcript relative to that of the ubiquitin transcript is given in the graphs, normalized so that the maximum signal of cZ equals 10. Black circles, tZ; white circles, cZ; white triangles, iP. Photographs of the original blots are shown in the insets.

