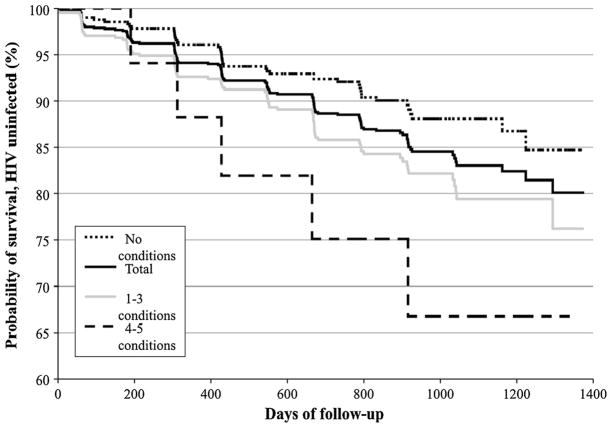
Fig. 1.
HIV incidence (Kaplan–Meier analysis) in the HIV-negative fraction of the cohort (N = 1,002). The total estimated HIV incidence was 19.9 % (dark solid line). Among participants reporting no conditions, HIV incidence was 15.3 % (dashed dotted line); among participants reporting 1–3 conditions, 23.7 % (grey solid line); and among participants reporting 4–5 conditions, 33.2 % (dashed line) (log rank test, P < 0.01)

