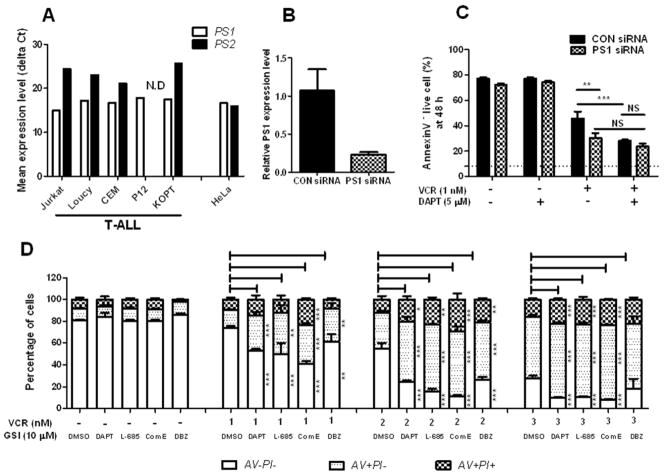
Fig. 3. The GSI effect in combination with VCR is not off-target pharmacological effect.
(a) The expression of presenilin isoforms (PS1 and PS2) in T-ALL cell lines was determined by quantitative RT-PCR. Mean expression levels (delta Ct) of each transcript are presented as cycle threshold (Ct) values normalized to the endogenous 18S rRNA. N.D; not detected. (b) PS1 was knocked down in Jurkat cells using siRNAs. Knock-down efficiency was determined by quantitative RT-PCR. PS1 expression level in CON siRNAs transfected cells was set to 1. (c) Jurkat cells transfected with PS1 siRNAs or CON siRNAs were treated with VCR alone (1 nM) or in combination with DAPT (5 μM) for 48 h and viable cells were measured with Annexin V (AV) and Propidium Iodide (PI) binding assay. Results are presented as mean ± SD of triplicate assays. The statistical significance of differences was determined by ANOVA test; *, p < 0.05; **, p < 0.01; ***, p< 0.001; NS, Not Significant. (d) Jurkat cells were treated with varying concentrations of VCR (1–3 nM) and/or 10 μM of different GSIs (DAPT, L-685,458, Compound E, and DBZ) or DMSO for 48 h. Annexin V (AV) and Propidium Iodide (PI) binding was measured by flow cytometry. The percentage of viable cells (AV-PI-), early apoptotic cells (AV+PI-), and late apoptotic cells (AV+PI+) is graphed. Results are presented as mean ± SD of triplicate assays. The statistical significance of differences was determined by ANOVA test; *, p < 0.05; **, p < 0.01; ***, p< 0.001

