
Fig. 1.
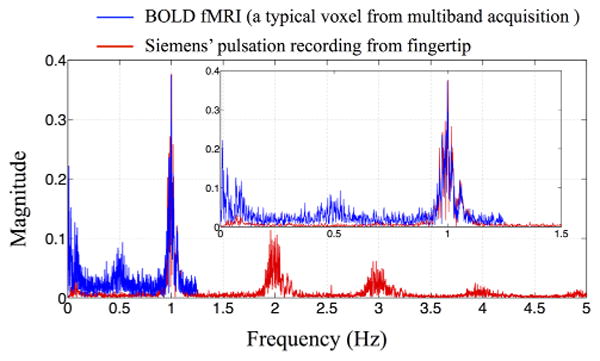
The spectra of the BOLD signal of one typical voxel (in blue) from multiband echo-planar image (EPI) sequence and of simultaneous recordings from the Siemens’ fingertip pulse oximeter (in red). The inset shows the enlarged section between 0 and 1.5 Hz. Each plot has been normalized to the cardiac amplitude. [Color figure can be viewed in the online issue, which is available at wileyonlinelibrary.com.]