
Fig. 4.
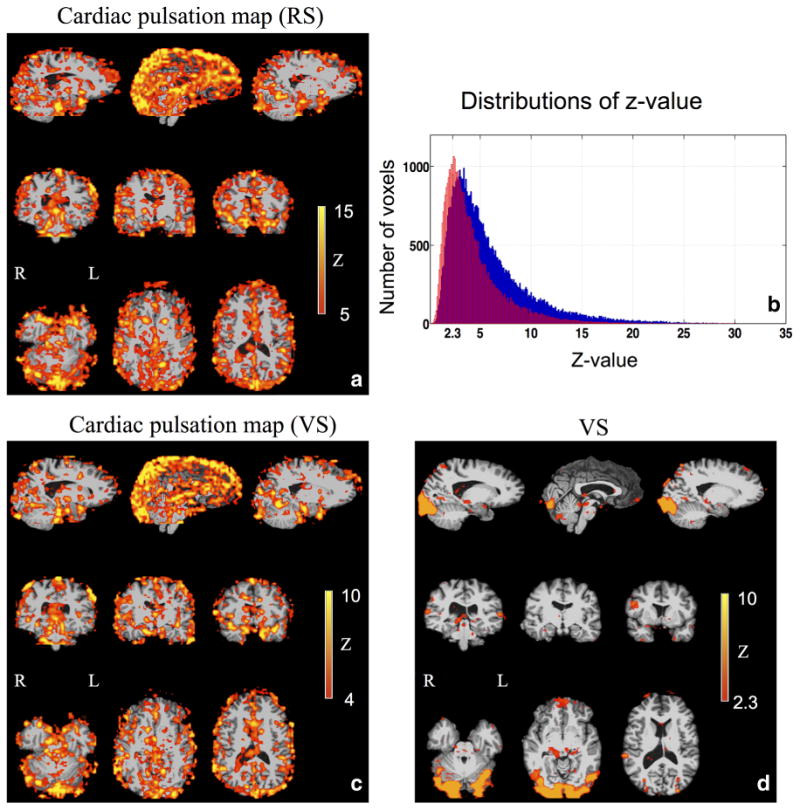
The static cardiac pulsation map calculated from resting state (RS) scan (a) and visual stimulation (VS) task (c) from the same participant are shown. The corresponding distributions of the z-values are depicted in blue and red respectively in (b). The activation map (z-statistic map) of a visual stimulation task is shown in (d).