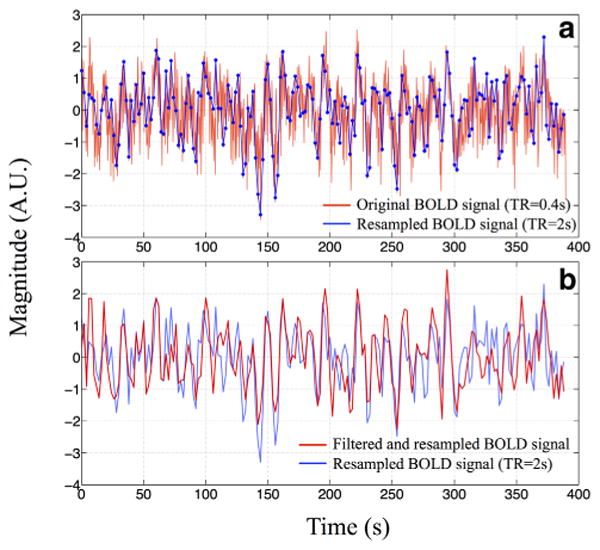
Fig. 8.

The temporal trace of one BOLD fMRI signal (TR=0.4 s) from the multiband echo-planar image (EPI) sequence in red together with its downsampled version (TR=2 s) in blue is shown in (a). The same downsampled temporal trace (in blue) was compared with the trace (in red) that had been bandpass filtered (0.01–0.25 Hz) before the downsampling (TR=2 s) in (b). [Color figure can be viewed in the online issue, which is available at wileyonlinelibrary.com.]
