Figure 4.
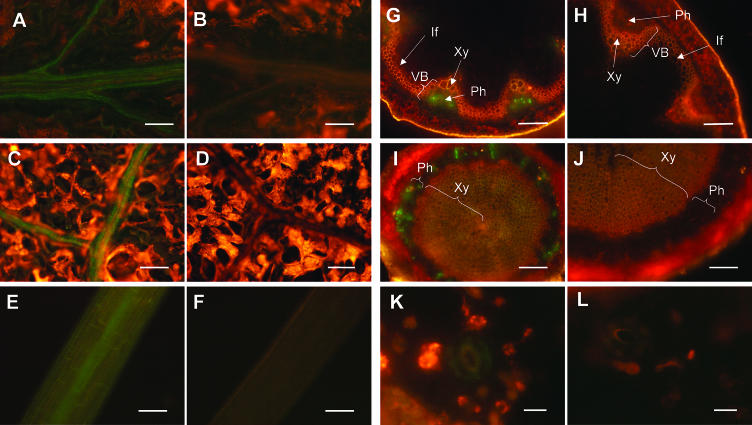
Localization of AAO3-GFP protein in AAO3-GFP transgenic aao3 plants. GFP-fluorescence images of AAO3-GFP transgenic plants (A, C, E, G, I, and K) and nontransformed plants (B, D, F, H, J, and L) are shown. The expression of AAO3-GFP protein in 1-month-old plants (A–D and G–L) and 3-d-old plants grown in the dark (E and F) were determined using epifluorescence microscopy. GFP-fluorescence images of AAO3-GFP transgenic plants are shown. A and B, GFP-fluorescence images of the main veins. C and D, GFP-fluorescence images of the lateral veins. E and F, GFP-fluorescence images of the etiolated hypocotyls. G and H, GFP-fluorescence images of the inflorescence stems. I and J, GFP-fluorescence images of the hypocotyls of a mature plant. K and L, GFP-fluorescence images of an epidermal peel. Green fluorescent signals indicate the localization of GFP-tagged AAO3 protein. Red fluorescence indicates autofluorescence of the chlorophylls. VB, vascular bundle; Ph, phloem; Xy, xylem; If, interfascicular region. Bars = 100 μm for A to J and 10 μm for K and L.

