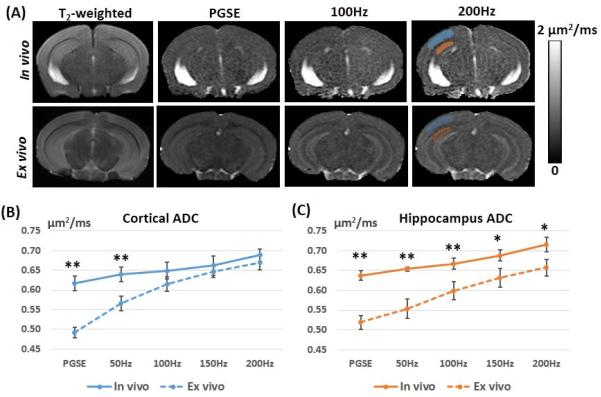
Fig. 1.
Comparisons of in vivo and ex vivo ADC maps of the adult mouse brain acquired using pulsed gradient spin echo (PGSE) and oscillating gradient spin echo (OGSE) methods. A: Axial T2-weighted, PGSE-ADC, and OGSE-ADC (at 100 and 200 Hz) images of a representative adult mouse brain. The blue and red shadings indicate the regions of interest that are manually placed to obtain ADC values in the cortex and hippocampus, respectively. B-C: Plots of in vivo ADC (solid lines) and ex vivo ADC (dashed lines) values measured in the cortex and hippocampus at different frequencies (n = 5). Error bars indicate the inter-subject standard deviation. * and ** denote that a two-tailed t-test between the in vivo and ex vivo measurements produced a p-value less than 0.01 and 0.001, respectively.

