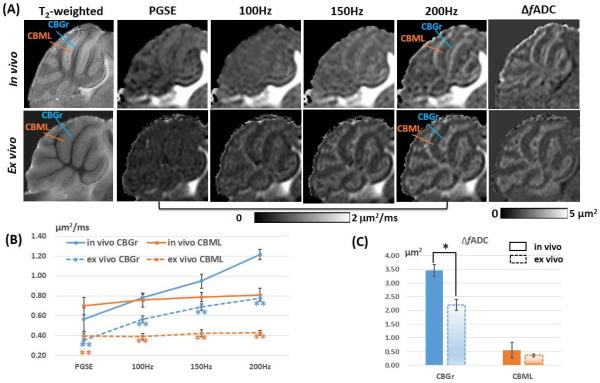
Fig. 2.
Frequency-dependent tissue contrast in the adult mouse cerebellum. A: Para-sagittal (0.6 mm off the midline) T2-weighted, PGSE-ADC, OGSE-ADC, and fitted ΔfADC images of the in vivo and ex vivo mouse cerebellum. The orange lines indicate the location of the cerebellar molecular layer (CBML), and the blue lines indicate the location of the cerebellar granule cell layer (CBGr). B: Plots of in vivo and ex vivo ADC values measured in the CBGr and CBML at different frequencies (n = 5). C: Comparison of the in vivo and ex vivo ΔfADC values in the CBGr and CBML (n = 5). Error bars indicate the inter-subject standard deviation. * and ** denote that a two-tailed t-test between the in vivo and ex vivo measurements produced a p-value less than 0.05 and 0.001, respectively.

