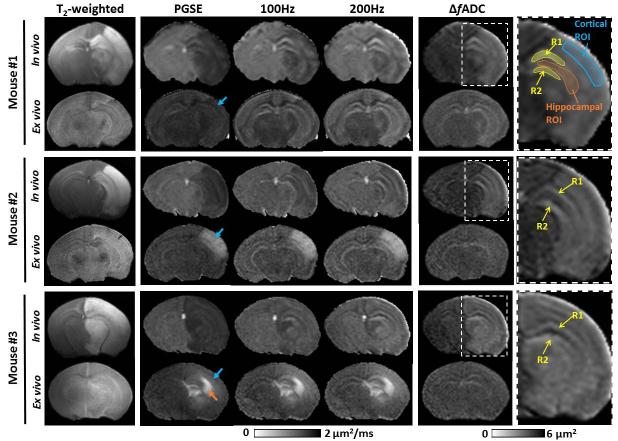
Fig. 3.
Representative MR images of three (out of six) P11 mice with severe edema in the cortex and hippocampus. Axial T2-weighted, PGSE-ADC, OGSE-ADC (at 100 and 200 Hz), and ΔfADC maps were shown. Both in vivo and ex vivo MR images were displayed. The blue and orange arrows indicate high signal variations in the ipsilateral cortical and hippocampal regions of ex vivo specimens, respectively. The yellow arrows indicate two layers (R1/R2) in the ipsilateral hippocampus that were enhanced at 200 Hz. Definitions of the cortical, hippocampal and R1/R2 ROIs were superimposed on the enlarged ΔfADC map of the injured hemisphere.

